

1. 方法論と範囲
1.1. 調査方法
1.2. 調査目的と調査範囲
2. 定義と概要
3. エグゼクティブ・サマリー
3.1. タイプ別スニペット
3.2. ソース別スニペット
3.3. 機能別スニペット
3.4. アプリケーション別スニペット
3.5. 地域別スニペット
4. ダイナミクス
4.1. 影響要因
4.1.1. 推進要因
4.1.1.1. 多業種にわたるpH調整剤と酸性化剤の多様な用途
4.1.1.2. pH調整剤市場における革新性と持続可能性
4.1.2. 阻害要因
4.1.2.1. 原材料の価格変動
4.1.3. 機会
4.1.4. 影響分析
5. 産業分析
5.1. ポーターのファイブフォース分析
5.2. サプライチェーン分析
5.3. 価格分析
5.4. 規制分析
5.5. DMI意見
6. タイプ別
6.1. はじめに
6.1.1. 市場規模分析および前年比成長率分析(%), タイプ別
6.1.2. 市場魅力度指数(タイプ別
6.2. 有機酸味料
6.2.1. 序論
6.2.2. 市場規模分析と前年比成長率分析(%)
6.2.3. クエン酸
6.2.4. 乳酸
6.2.5. リンゴ酸
6.2.6. 酒石酸
6.2.7. 酢酸
6.3. 無機酸味料
6.3.1. リン酸
6.3.2. 硫酸
6.3.3. pH調整剤
6.3.4. 炭酸水素ナトリウム
6.3.5. 炭酸カリウム
6.3.6. 水酸化アンモニウム
6.4. 混合酸味料
7. 供給源別
7.1. はじめに
7.1.1. ソース別市場規模分析および前年比成長率分析(%).
7.1.2. 市場魅力度指数, 供給源別
7.2. 天然酸味料
7.2.1. はじめに
7.2.2. 市場規模分析と前年比成長率分析(%)
7.3. 合成酸味料
8. 機能別
8.1. はじめに
8.2. 機能別市場規模分析および前年比成長率分析(%)
8.3. 市場魅力度指数(機能別
8.4. pH安定化
8.4.1. はじめに
8.4.2. 市場規模分析と前年比成長率分析(%)
8.5. フレーバー強化
8.6. 保存と賞味期限延長
8.7. 食感改良
9. 用途別
9.1. 導入
9.1.1. 市場規模分析および前年比成長率分析(%), アプリケーション別
9.1.2. 市場魅力度指数(用途別
9.2. 食品・飲料
9.2.1. 序論
9.2.2. 市場規模分析と前年比成長率分析(%)
9.3. 医薬品
9.4. パーソナルケア
9.5. 産業用途
10. 地域別
10.1. はじめに
10.1.1. 地域別市場規模分析および前年比成長率分析(%)
10.1.2. 市場魅力度指数、地域別
10.2. 北米
10.2.1. 序論
10.2.2. 主な地域別ダイナミクス
10.2.3. 市場規模分析および前年比成長率分析(%), タイプ別
10.2.4. 市場規模分析とYoY成長率分析(%), 供給源別
10.2.5. 市場規模分析および前年比成長率分析(%), 機能別
10.2.6. 市場規模分析および前年比成長率分析(%), 用途別
10.2.7. 市場規模分析および前年比成長率分析(%)、国別
10.2.7.1. 米国
10.2.7.2. カナダ
10.2.7.3. メキシコ
10.3. ヨーロッパ
10.3.1. はじめに
10.3.2. 主な地域別ダイナミクス
10.3.3. 市場規模分析および前年比成長率分析(%), タイプ別
10.3.4. 市場規模分析とYoY成長率分析(%), 供給源別
10.3.5. 市場規模分析および前年比成長率分析(%), 機能別
10.3.6. 市場規模分析および前年比成長率分析(%)、用途別
10.3.7. 市場規模分析および前年比成長率分析(%)、国別
10.3.7.1. ドイツ
10.3.7.2. イギリス
10.3.7.3. フランス
10.3.7.4. イタリア
10.3.7.5. スペイン
10.3.7.6. その他のヨーロッパ
10.4. 南米
10.4.1. はじめに
10.4.2. 地域別主要市場
10.4.3. 市場規模分析および前年比成長率分析(%), タイプ別
10.4.4. 市場規模分析およびYoY成長率分析(%)、供給源別
10.4.5. 市場規模分析および前年比成長率分析(%), 機能別
10.4.6. 市場規模分析および前年比成長率分析(%)、用途別
10.4.7. 市場規模分析および前年比成長率分析(%)、国別
10.4.7.1. ブラジル
10.4.7.2. アルゼンチン
10.4.7.3. その他の南米諸国
10.5. アジア太平洋
10.5.1. 序論
10.5.2. 主な地域別ダイナミクス
10.5.3. 市場規模分析および前年比成長率分析(%), タイプ別
10.5.4. 市場規模分析および前年比成長率分析(%)、供給源別
10.5.5. 市場規模分析および前年比成長率分析(%), 機能別
10.5.6. 市場規模分析および前年比成長率分析(%), 用途別
10.5.7. 市場規模分析および前年比成長率分析(%)、国別
10.5.7.1. 中国
10.5.7.2. インド
10.5.7.3. 日本
10.5.7.4. オーストラリア
10.5.7.5. その他のアジア太平洋地域
10.6. 中東・アフリカ
10.6.1. 序論
10.6.2. 主な地域別ダイナミクス
10.6.3. 市場規模分析および前年比成長率分析(%), タイプ別
10.6.4. 市場規模分析およびYoY成長率分析(%)、供給源別
10.6.5. 市場規模分析および前年比成長率分析(%), 機能別
10.6.6. 市場規模分析および前年比成長率分析(%), 用途別
11. 競争環境
11.1. 競争シナリオ
11.2. 市場ポジショニング/シェア分析
11.3. M&A分析
12. 企業プロフィール
12.1. Cargill, Incorporated
12.1.1. Company Overview
12.1.2. Nature Portfolio and Description
12.1.3. Financial Overview
12.1.4. Key Developments
12.2. ADM
12.3. Corbion N.V.
12.4. Jungbunzlauer Suisse AG
12.5. Merck KGaA
12.6. Wang Pharmaceuticals and Chemicals
12.7. CheMondis GmbH
12.8. Jaysons Chemical Industries
12.9. Vinipul Inorganics India Pvt. Ltd
12.10. JIAAN BIOTECH
リストは網羅的ではありません
13. 付録
13.1. 会社概要とサービス
13.2. お問い合わせ
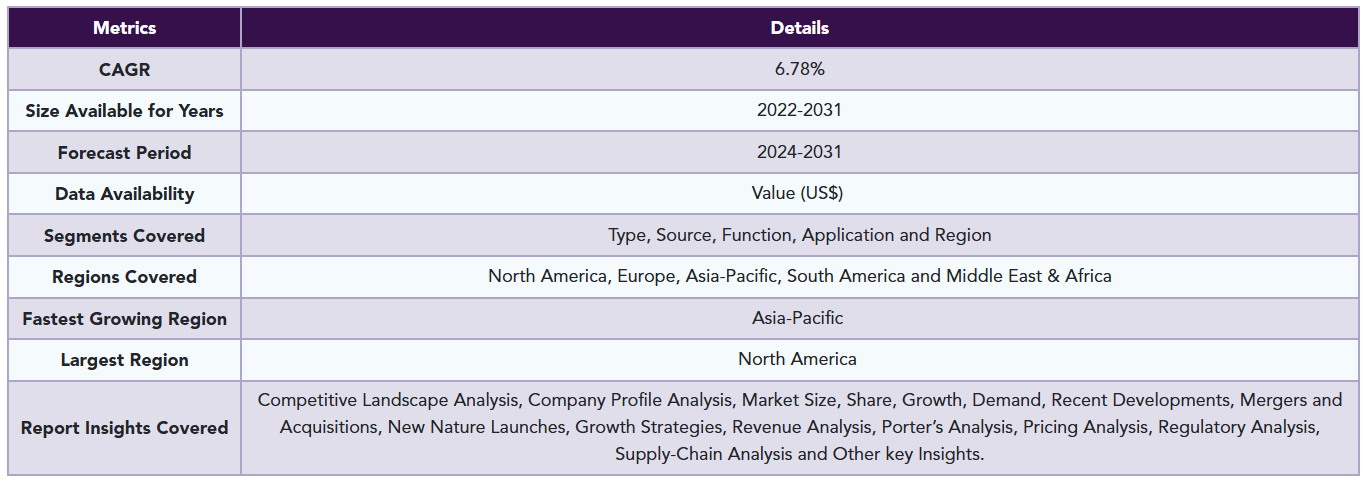
Global pH Control Agents and Acidulants Market reached US$ 5.8 billion in 2023 and is expected to reach US$ 9.8 billion by 2031, growing with a CAGR of 6.78% during the forecast period 2024-2031.
The rise in processed food consumption, health-conscious trends and the growing need for precise pH control in industrial applications are major factors fueling the market expansion. The growth is primarily driven by demand in the food and beverage, pharmaceutical and agricultural sectors. These agents, including citric acid, lactic acid and phosphoric acid, are essential for maintaining desired pH levels, enhancing flavor, extending shelf life and ensuring product stability.
Additionally, the growing trend for clean-label products is increasing the demand for natural acidulants like citric and tartaric acid. The market is also bolstered by the growing demand for sustainable and natural solutions, as industries increasingly focus on clean-label products and eco-friendly practices. Beyond food and beverages, pH control agents are also in high demand from the pharmaceutical, agricultural and industrial sectors, driving further growth.
US processed food export value of US$ 36.61 billion in 2023 highlights North America's dominance in the global food trade, driving the demand for pH control agents and acidulants, as these are essential for maintaining the quality, safety and shelf life of processed foods. With US being a major exporter, it boosts the global market for pH regulation, as food products need consistent acidity control to meet international standards.
Dynamics
Diverse Applications of pH Control Agents And Acidulants Across Multiple Industries
In the food and beverage sector, acidulants are used to regulate acidity, enhance flavors and extend shelf life in products like soft drinks, juices and processed foods. Similarly, in the pharmaceutical industry, these agents play a crucial role in drug formulation and controlled-release systems, while in agriculture, they help optimize soil pH and improve fertilizer efficiency.
Additionally, pH control agents are key in water treatment, personal care, cosmetics and chemical processing, where they maintain product quality and stability across a variety of formulations. The versatility of pH control agents across sectors like cleaning, pollution control and textile processing further contributes to their widespread use. As consumer preferences shift toward health-conscious, effective and environmentally responsible products, the need for reliable pH control agents is on the rise.
Innovation and Sustainability in the pH Control Agents Market
As the global food, beverage and pharma industry increasingly shifts toward sustainability, the demand for natural, eco-friendly ingredients is reshaping the landscape of food additives, particularly in the sector. The market for pH control agents, including acidulants, is one area where this transformation is most visible. In response to growing consumer preference for healthier, cleaner-label products, manufacturers are also introducing new and innovative products into the market.
For instance, in August 2024, Anhui Huaheng Biotechnology introduced Bioscentis MA, a bio-based L-malic acid that offers a sustainable and innovative solution for the confectionery industry. This acidulant provides a smooth, long-lasting sour flavor with 1.2 times the acidity of citric acid, delivering a balanced, apple-like taste ideal for modern candy formulations. Bioscentis MA enhances flavor while meeting the growing demand for eco-friendly, natural ingredients.
Price Volatility of Raw Materials
Many acidulants and pH control agents, such as citric acid (derived from citrus fruits) and lactic acid (produced via fermentation), rely heavily on natural resources. The availability and cost of these raw materials are subject to fluctuations due to several factors, including agricultural conditions, climate variability and trade policies. These fluctuations can lead to price instability in the production of pH control agents and acidulants.
Additionally, cost pressure on manufacturers arises when raw material prices increase, directly impacting the production costs of these chemicals. As a result, manufacturers may face challenges in maintaining profitability, as higher production costs can lead to increased prices for end consumers or reduce profit margins. The dependency on natural resources, combined with external factors affecting their supply, contributes to significant market volatility and challenges in price forecasting.
Segment Analysis
The global pH control agents and acidulants market is segmented based on type, source, function, application and region.
Increasing Demand for Clean-Label Products
The global pH control agents and acidulants market is segmented based on type into natural and synthetic. Natural acidulants are gaining momentum with the growing demand for clean-label products those free from artificial additives and chemicals have led manufacturers to seek natural alternatives. Natural acidulants, such as citric acid from citrus fruits or malic acid from apples, align with consumer preferences for organic, non-GMO and sustainably sourced ingredients.
Additionally, the rise in health consciousness and the popularity of functional foods and beverages, such as probiotics, nutritional supplements and low-sugar alternatives, is driving the demand for natural acidulants. These ingredients are not only considered safer but also contribute to the overall appeal of products marketed as natural or clean. As consumers increasingly prioritize sustainability and traceability in food production, natural acidulants are becoming a preferred choice for manufacturers.
Geographical Penetration
Strong Manufacturing Capacity in North America
North America is a dominant region in the global pH control agents and acidulants market, driven by its large and mature food and beverage industry. Acidulants are essential in a variety of foods and beverages to adjust acidity, enhance flavor and extend shelf life. The region's strong consumer demand for processed foods, combined with a well-established regulatory environment, further boosts the need for high-quality acidulants.
Large chemical and food ingredient companies based in North America, such as Cargill and ADM, play a key role in driving market growth. Their extensive distribution networks and strong R&D capabilities also contribute to the region's dominance. The regional companies are often at the forefront of research and development in food science and chemical engineering. The innovation in pH control technologies, as well as sustainable production methods for acidulants, supports the region’s leadership in the market.
Competitive Landscape
The major global players in the market include Cargill, Incorporated, ADM, Corbion N.V., Jungbunzlauer Suisse AG, Merck KGaA, Wang Pharmaceuticals and Chemicals, CheMondis GmbH, Jaysons Chemical Industries, Vinipul Inorganics India Pvt. Ltd and JIAAN BIOTECH.
Russia-Ukraine War Impact
The Russia-Ukraine war has disrupted the global supply of pH control agents and acidulants, crucial chemicals used in food, beverages, agriculture and manufacturing. Key ingredients like citric acid, phosphoric acid and sulfur, which are sourced from the region, have faced supply shortages due to factory closures, transportation delays and rising energy costs. This has led to increased production costs and price volatility, with many companies scrambling to find alternative suppliers.
The conflict has also prompted shifts in trade patterns and sourcing strategies, with companies turning to regions like North America, China and India for more stable supplies. As a result, manufacturers are dealing with higher costs and potential demand fluctuations in industries that rely on these chemicals. In the longer term, there may be a push towards more sustainable, efficient production methods and diversifying supply chains to reduce dependency on unstable regions.
By Type
• Organic Acidulants
o Citric Acid
o Lactic Acid
o Malic Acid
o Tartaric Acid
o Acetic Acid
• Inorganic Acidulants
o Phosphoric Acid
o Sulfuric Acid
• pH Control Agents
o Sodium Bicarbonate
o Potassium Carbonate
o Ammonium Hydroxide
• Blended Acidulants
By Source
• Natural Acidulants
• Synthetic Acidulants
By Function
• pH Stabilization
• Flavor Enhancement
• Preservation & Shelf-life Extension
• Texture Modification
By Application
• Food and Beverages
• Pharmaceuticals
• Personal Care
• Industrial Applications
By Region
• North America
o US
o Canada
o Mexico
• Europe
o Germany
o UK
o France
o Italy
o Spain
o Rest of Europe
• South America
o Brazil
o Argentina
o Rest of South America
• Asia-Pacific
o China
o India
o Japan
o Australia
o Rest of Asia-Pacific
• Middle East and Africa
Why Purchase the Report?
• To visualize the global pH control agents and acidulants market segmentation based on type, source, function, application and region, as well as understand key commercial assets and players.
• Identify commercial opportunities by analyzing trends and co-development.
• Excel data sheet with numerous pH control agents and acidulants market-level data points with all segments.
• PDF report consists of a comprehensive analysis after exhaustive qualitative interviews and an in-depth study.
• Product mapping available as excel consisting of key products of all the major players.
The global pH control agents and acidulants market report would provide approximately 70 tables, 63 figures and 206 pages.
Target Audience 2024
• Manufacturers/ Buyers
• Industry Investors/Investment Bankers
• Research Professionals
• Emerging Companies
1. Methodology and Scope
1.1. Research Methodology
1.2. Research Objective and Scope of the Report
2. Definition and Overview
3. Executive Summary
3.1. Snippet by Type
3.2. Snippet by Source
3.3. Snippet by Function
3.4. Snippet by Application
3.5. Snippet by Region
4. Dynamics
4.1. Impacting Factors
4.1.1. Drivers
4.1.1.1. Diverse Applications of pH Control Agents and Acidulants Across Multiple Industries
4.1.1.2. Innovation and Sustainability in the pH Control Agents Market
4.1.2. Restraints
4.1.2.1. Price Volatility of Raw Materials
4.1.3. Opportunity
4.1.4. Impact Analysis
5. Industry Analysis
5.1. Porter's Five Force Analysis
5.2. Supply Chain Analysis
5.3. Pricing Analysis
5.4. Regulatory Analysis
5.5. DMI Opinion
6. By Type
6.1. Introduction
6.1.1. Market Size Analysis and Y-o-Y Growth Analysis (%), By Type
6.1.2. Market Attractiveness Index, By Type
6.2. Organic Acidulants
6.2.1. Introduction
6.2.2. Market Size Analysis and Y-o-Y Growth Analysis (%)
6.2.3. Citric Acid
6.2.4. Lactic Acid
6.2.5. Malic Acid
6.2.6. Tartaric Acid
6.2.7. Acetic Acid
6.3. Inorganic Acidulants
6.3.1. Phosphoric Acid
6.3.2. Sulfuric Acid
6.3.3. pH Control Agents
6.3.4. Sodium Bicarbonate
6.3.5. Potassium Carbonate
6.3.6. Ammonium Hydroxide
6.4. Blended Acidulants
7. By Source
7.1. Introduction
7.1.1. Market Size Analysis and Y-o-Y Growth Analysis (%), By Source
7.1.2. Market Attractiveness Index, By Source
7.2. Natural Acidulants
7.2.1. Introduction
7.2.2. Market Size Analysis and Y-o-Y Growth Analysis (%)
7.3. Synthetic Acidulants
8. By Function
8.1. Introduction
8.2. Market Size Analysis and Y-o-Y Growth Analysis (%), By Function
8.3. Market Attractiveness Index, By Function
8.4. pH Stabilization
8.4.1. Introduction
8.4.2. Market Size Analysis and Y-o-Y Growth Analysis (%)
8.5. Flavor Enhancement
8.6. Preservation & Shelf-life Extension
8.7. Texture Modification
9. By Application
9.1. Introduction
9.1.1. Market Size Analysis and Y-o-Y Growth Analysis (%), By Application
9.1.2. Market Attractiveness Index, By Application
9.2. Food & Beverages
9.2.1. Introduction
9.2.2. Market Size Analysis and Y-o-Y Growth Analysis (%)
9.3. Pharmaceuticals
9.4. Personal Care
9.5. Industrial Applications
10. By Region
10.1. Introduction
10.1.1. Market Size Analysis and Y-o-Y Growth Analysis (%), By Region
10.1.2. Market Attractiveness Index, By Region
10.2. North America
10.2.1. Introduction
10.2.2. Key Region-Specific Dynamics
10.2.3. Market Size Analysis and Y-o-Y Growth Analysis (%), By Type
10.2.4. Market Size Analysis and Y-o-Y Growth Analysis (%), By Source
10.2.5. Market Size Analysis and Y-o-Y Growth Analysis (%), By Function
10.2.6. Market Size Analysis and Y-o-Y Growth Analysis (%), By Application
10.2.7. Market Size Analysis and Y-o-Y Growth Analysis (%), By Country
10.2.7.1. US
10.2.7.2. Canada
10.2.7.3. Mexico
10.3. Europe
10.3.1. Introduction
10.3.2. Key Region-Specific Dynamics
10.3.3. Market Size Analysis and Y-o-Y Growth Analysis (%), By Type
10.3.4. Market Size Analysis and Y-o-Y Growth Analysis (%), By Source
10.3.5. Market Size Analysis and Y-o-Y Growth Analysis (%), By Function
10.3.6. Market Size Analysis and Y-o-Y Growth Analysis (%), By Application
10.3.7. Market Size Analysis and Y-o-Y Growth Analysis (%), By Country
10.3.7.1. Germany
10.3.7.2. UK
10.3.7.3. France
10.3.7.4. Italy
10.3.7.5. Spain
10.3.7.6. Rest of Europe
10.4. South America
10.4.1. Introduction
10.4.2. Key Region-Specific Dynamics
10.4.3. Market Size Analysis and Y-o-Y Growth Analysis (%), By Type
10.4.4. Market Size Analysis and Y-o-Y Growth Analysis (%), By Source
10.4.5. Market Size Analysis and Y-o-Y Growth Analysis (%), By Function
10.4.6. Market Size Analysis and Y-o-Y Growth Analysis (%), By Application
10.4.7. Market Size Analysis and Y-o-Y Growth Analysis (%), By Country
10.4.7.1. Brazil
10.4.7.2. Argentina
10.4.7.3. Rest of South America
10.5. Asia-Pacific
10.5.1. Introduction
10.5.2. Key Region-Specific Dynamics
10.5.3. Market Size Analysis and Y-o-Y Growth Analysis (%), By Type
10.5.4. Market Size Analysis and Y-o-Y Growth Analysis (%), By Source
10.5.5. Market Size Analysis and Y-o-Y Growth Analysis (%), By Function
10.5.6. Market Size Analysis and Y-o-Y Growth Analysis (%), By Application
10.5.7. Market Size Analysis and Y-o-Y Growth Analysis (%), By Country
10.5.7.1. China
10.5.7.2. India
10.5.7.3. Japan
10.5.7.4. Australia
10.5.7.5. Rest of Asia-Pacific
10.6. Middle East and Africa
10.6.1. Introduction
10.6.2. Key Region-Specific Dynamics
10.6.3. Market Size Analysis and Y-o-Y Growth Analysis (%), By Type
10.6.4. Market Size Analysis and Y-o-Y Growth Analysis (%), By Source
10.6.5. Market Size Analysis and Y-o-Y Growth Analysis (%), By Function
10.6.6. Market Size Analysis and Y-o-Y Growth Analysis (%), By Application
11. Competitive Landscape
11.1. Competitive Scenario
11.2. Market Positioning/Share Analysis
11.3. Mergers and Acquisitions Analysis
12. Company Profiles
12.1. Cargill, Incorporated
12.1.1. Company Overview
12.1.2. Nature Portfolio and Description
12.1.3. Financial Overview
12.1.4. Key Developments
12.2. ADM
12.3. Corbion N.V.
12.4. Jungbunzlauer Suisse AG
12.5. Merck KGaA
12.6. Wang Pharmaceuticals and Chemicals
12.7. CheMondis GmbH
12.8. Jaysons Chemical Industries
12.9. Vinipul Inorganics India Pvt. Ltd
12.10. JIAAN BIOTECH
LIST NOT EXHAUSTIVE
13. Appendix
13.1. About Us and Services
13.2. Contact Us
❖ 世界のpH調整剤&酸味料市場に関するよくある質問(FAQ) ❖
・pH調整剤&酸味料の世界市場規模は?
→DataM Intelligence社は2023年のpH調整剤&酸味料の世界市場規模を58億米ドルと推定しています。
・pH調整剤&酸味料の世界市場予測は?
→DataM Intelligence社は2031年のpH調整剤&酸味料の世界市場規模を98億米ドルと予測しています。
・pH調整剤&酸味料市場の成長率は?
→DataM Intelligence社はpH調整剤&酸味料の世界市場が2024年~2031年に年平均6.8%成長すると予測しています。
・世界のpH調整剤&酸味料市場における主要企業は?
→DataM Intelligence社は「Cargill, Incorporated, ADM, Corbion N.V., Jungbunzlauer Suisse AG, Merck KGaA, Wang Pharmaceuticals and Chemicals, CheMondis GmbH, Jaysons Chemical Industries, Vinipul Inorganics India Pvt. Ltd and JIAAN BIOTECH.など ...」をグローバルpH調整剤&酸味料市場の主要企業として認識しています。
※上記FAQの市場規模、市場予測、成長率、主要企業に関する情報は本レポートの概要を作成した時点での情報であり、納品レポートの情報と少し異なる場合があります。


