1. 方法論と範囲
1.1. 調査方法
1.2. 調査目的と調査範囲
2. 定義と概要
3. エグゼクティブ・サマリー
3.1. タイプ別スニペット
3.2. 治療タイプ別スニペット
3.3. 年齢層別スニペット
3.4. 販売チャネル別スニペット
3.5. 地域別スニペット
4. ダイナミクス
4.1. 影響要因
4.1.1. 推進要因
4.1.2. 緑内障の有病率の上昇
4.1.3. 阻害要因
4.1.3.1. 代替療法の利用可能性
4.1.4. 機会
4.1.5. 影響分析
5. 産業分析
5.1. ポーターのファイブフォース分析
5.2. サプライチェーン分析
5.3. 価格分析
5.4. 規制分析
5.5. 償還分析
5.6. 特許分析
5.7. SWOT分析
5.8. DMI意見
6. タイプ別
6.1. はじめに
6.1.1. 市場規模分析および前年比成長率分析(%), タイプ別
6.1.2. 市場魅力度指数(タイプ別
6.2. 開放隅角緑内障
6.2.1. 序論
6.2.2. 市場規模分析と前年比成長率分析(%)
6.3. 閉塞隅角緑内障
6.4. 先天性緑内障
6.5. その他
7. 治療タイプ別
7.1. はじめに
7.1.1. 治療タイプ別市場規模分析および前年比成長率分析(%) 7.1.2.
7.1.2. 市場魅力度指数(治療タイプ別
7.2. プロスタグランジン*製剤
7.2.1. 序論
7.2.2. 市場規模分析と前年比成長率分析(%)
7.3. β遮断薬
7.4. αアドレナリン作動薬
7.5. 炭酸脱水酵素阻害薬
7.6. 抗生物質
7.7. Rhoキナーゼ阻害剤
7.8. インプラント
7.9. その他
8. 年齢層別
8.1. はじめに
8.1.1. 市場規模分析および前年比成長率分析(%), 年齢層別
8.1.2. 市場魅力度指数(年齢層別
8.2. 子供*市場
8.2.1. はじめに
8.2.2. 市場規模分析と前年比成長率分析(%)
8.3. 大人
8.4. 高齢者
9. 流通チャネル別
9.1. はじめに
9.1.1. 市場規模分析および前年比成長率分析(%), 流通チャネル別
9.1.2. 市場魅力度指数(流通チャネル別
9.2. 病院薬局
9.2.1. 序論
9.2.2. 市場規模分析と前年比成長率分析(%)
9.3. 小売薬局
9.4. オンライン薬局
10. 地域別
10.1. はじめに
10.1.1. 地域別市場規模分析および前年比成長率分析(%)
10.1.2. 市場魅力度指数、地域別
10.2. 北米
10.2.1. 序論
10.2.2. 主な地域別ダイナミクス
10.2.3. 市場規模分析および前年比成長率分析(%), タイプ別
10.2.4. 市場規模分析およびYoY成長率分析(%)、治療タイプ別
10.2.5. 市場規模分析および前年比成長率分析(%):年齢層別
10.2.6. 市場規模分析および前年比成長率分析(%):流通チャネル別
10.2.7. 市場規模分析および前年比成長率分析(%), 国別
10.2.7.1. 米国
10.2.7.2. カナダ
10.2.7.3. メキシコ
10.3. ヨーロッパ
10.3.1. はじめに
10.3.2. 主な地域別ダイナミクス
10.3.3. 市場規模分析および前年比成長率分析(%), タイプ別
10.3.4. 市場規模分析およびYoY成長率分析(%)、治療タイプ別
10.3.5. 市場規模分析および前年比成長率分析(%):年齢層別
10.3.6. 市場規模分析および前年比成長率分析(%):流通チャネル別
10.3.7. 市場規模分析および前年比成長率分析(%), 国別
10.3.7.1. ドイツ
10.3.7.2. イギリス
10.3.7.3. フランス
10.3.7.4. イタリア
10.3.7.5. スペイン
10.3.7.6. その他のヨーロッパ
10.4. 南米
10.4.1. はじめに
10.4.2. 地域別主要市場
10.4.3. 市場規模分析および前年比成長率分析(%), タイプ別
10.4.4. 市場規模分析およびYoY成長率分析(%)、治療タイプ別
10.4.5. 市場規模分析および前年比成長率分析(%):年齢層別
10.4.6. 市場規模分析および前年比成長率分析(%):流通チャネル別
10.4.7. 市場規模分析および前年比成長率分析(%), 国別
10.4.7.1. ブラジル
10.4.7.2. アルゼンチン
10.4.7.3. その他の南米諸国
10.5. アジア太平洋
10.5.1. 序論
10.5.2. 主な地域別ダイナミクス
10.5.3. 市場規模分析および前年比成長率分析(%), タイプ別
10.5.4. 市場規模分析およびYoY成長率分析(%)、治療タイプ別
10.5.5. 市場規模分析および前年比成長率分析(%):年齢層別
10.5.6. 市場規模分析および前年比成長率分析(%):流通チャネル別
10.5.7. 市場規模分析および前年比成長率分析(%), 国別
10.5.7.1. 中国
10.5.7.2. インド
10.5.7.3. 日本
10.5.7.4. 韓国
10.5.7.5. その他のアジア太平洋地域
10.6. 中東・アフリカ
10.6.1. 序論
10.6.2. 主な地域別ダイナミクス
10.6.3. 市場規模分析および前年比成長率分析(%), タイプ別
10.6.4. 市場規模分析およびYoY成長率分析(%)、治療タイプ別
10.6.5. 市場規模分析および前年比成長率分析(%):年齢層別
10.6.6. 市場規模分析および前年比成長率分析(%):流通チャネル別
11. 競合情勢
11.1. 競争シナリオ
11.2. 市場ポジショニング/シェア分析
11.3. M&A分析
12. 企業プロフィール
12.1. Novartis AG *
12.1.1. Company Overview
12.1.2. Product Portfolio and Description
12.1.3. Financial Overview
12.1.4. Key Developments
12.2. Bausch + Lomb.
12.3. Viatris Inc.
12.4. AbbVie.
12.5. Alcon Inc.
12.6. Thea Pharma Inc.
12.7. Pfizer Inc.
12.8. Santen Pharmaceutical Co., Ltd.
12.9. Sun Pharmaceutical Industries, Inc.
12.10. Somerset Pharma LLC
リストは網羅的ではありません
13. 付録
13.1. 会社概要とサービス
13.2. お問い合わせ

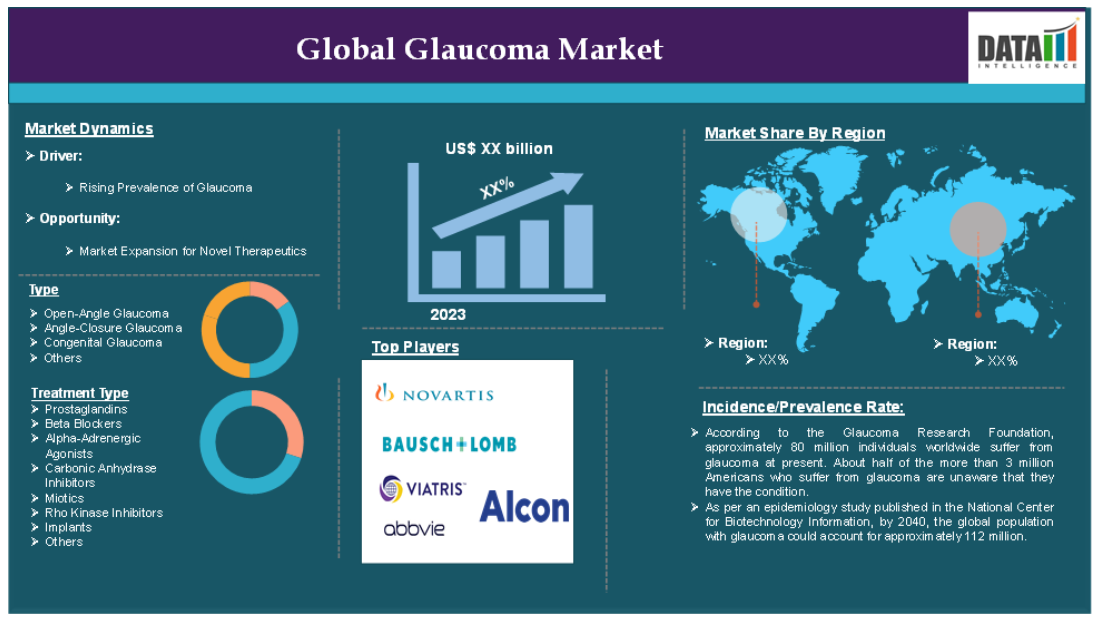
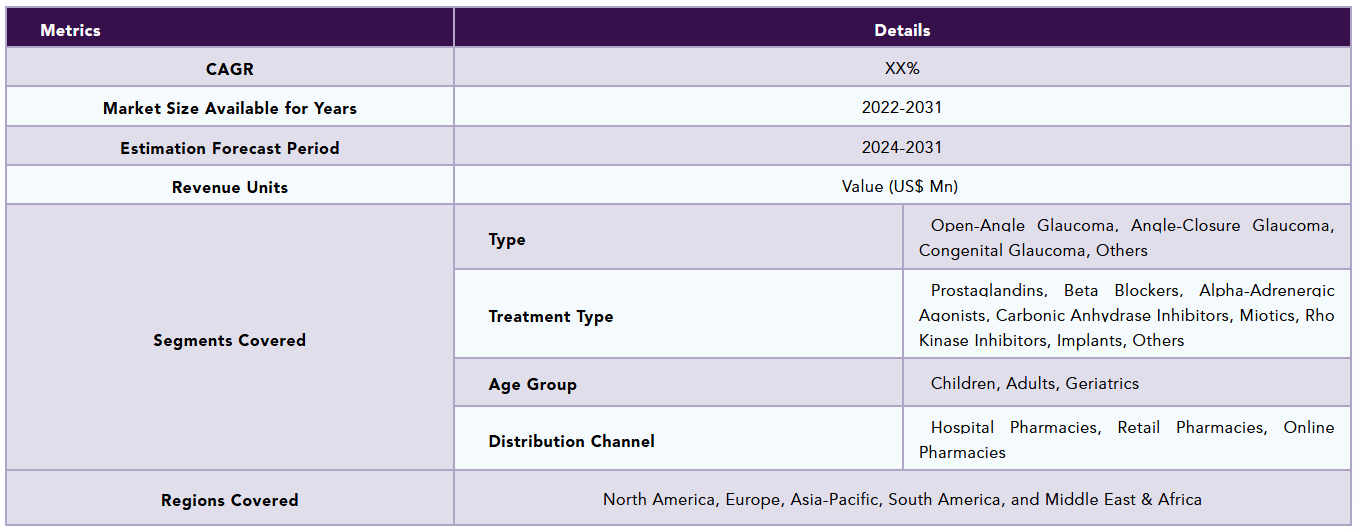
The global glaucoma market reached US$ 8.36 billion in 2023 and is expected to reach US$ 12.77 billion by 2031, growing at a CAGR of 5.5% during the forecast period 2024-2031.
Glaucoma is a group of eye conditions characterized by progressive vision loss and blindness caused by damage to the optic nerve. The optic nerve plays a crucial role in relaying signals from the brain to the eye. The damage is caused by an excessive buildup of aqueous humor in the eye, which results in higher intraocular pressure and ultimately damages the optic nerve.
The global glaucoma market is driven by the increasing prevalence of glaucoma. For instance, according to the Glaucoma Research Foundation, approximately 80 million individuals worldwide suffer from glaucoma at present. About half of the more than 3 million Americans who suffer from glaucoma are unaware that they have the condition.
Market Dynamics: Drivers & Restraints
Rising prevalence of glaucoma
The market for Glaucoma is expected to attain lucrative growth in the forecast period, driven by the rising prevalence. Glaucoma is majorly seen in elderly people above 60 years of age. The current global population is aging and they are at a higher risk of developing the condition. For instance, according to the Glaucoma Research Foundation, there are approximately 80 million glaucoma patients worldwide at present, and by 2040, approximately 22 million individuals will be blind due to glaucoma.
The foundation also states that the aging population is at a higher risk of developing glaucoma. According to the United Nations, the global population above 60 years of age is expected to reach 1.42 billion in 2030 from 1.14 billion in 2023. As per an epidemiology study published in the National Center for Biotechnology Information, by 2040, the global population with glaucoma could account for approximately 112 million.As the prevalence rises, the demand for advanced therapeutics is anticipated to rise continuously driving the market growth.
Availability of alternate therapies
The growth of the global glaucoma market is constrained by the increasing availability of alternative therapies, which shifts demand away from traditional surgical methods and standard medication delivery systems. The expansion of generic options intensifies competition, while evolving patient preferences further challenge adherence to conventional pharmaceutical treatments. As both patients and healthcare providers explore new therapeutic options, the preference for these alternatives may limit the growth potential of established glaucoma drugs and surgical procedures.
Segment Analysis
The global glaucoma market is segmented based on type, treatment type, age group, distribution channel, and region.
Treatment Type:
Prostaglandins segment is expected to dominate the glaucoma market sharerostaglandins segment is expected to dominate the glaucoma market share due to their promising results in glaucoma treatment. In recent times, prostaglandins have evolved as a promising therapeutic class for glaucoma treatment. This prostaglandin class includes drugs like latanoprost, bimatoprost, travoprost, and others. These drugs decrease the intraocular pressure (IOP) in glaucoma by increasing the uveoscleral outflow. The built-up aqueous humor will be drained out and results in the reduction of pressure on the optic nerve.
These drugs have rapidly replaced beta blockers which were once the first-line agents for glaucoma. This rapid shift is primarily due to their efficacy, ease of usage, and limited adverse effect profile. Several research studies have concluded that prostaglandins are efficacious in reducing intra-ocular pressure, and at regular doses, there are little to no side effects. For instance, Moreover, manufacturers are focused on developing this class of medication, as they have proven their benefits in glaucoma treatment. For instance, in December 2024, the U.S. Food and Drug Administration (FDA) approved iDoseTR (travoprost intracameral implant) developed by Glaukos Corporation. iDoseTR is a long-duration intracameral therapy designed to continuously deliver prostaglandin at therapeutic levels.
Alpha-adrenergic agonists segment is the fastest growing segment in the glaucoma market share
The significant expansion of the alpha-adrenergic agonists segment in the glaucoma market can be attributed to their efficiency in lowering IOP, acceptable safety profile, increased prevalence of glaucoma, and advances in drug delivery techniques. As healthcare practitioners become more aware of the benefits of these drugs, their involvement in managing glaucoma is likely to grow, cementing their status as an important component of modern glaucoma management.
Type:
Open-angle glaucoma segment is expected to dominate the glaucoma market share
The open-angle glaucoma segment is expected to hold the dominant position in the glaucoma market share. This is due to the increasing incidence of open-angle glaucoma. Open-angle glaucoma is a chronic eye condition characterized by increased intraocular pressure, potentially leading to optic nerve damage and vision loss. As the most common type of glaucoma, it often develops gradually without noticeable symptoms until advanced stages.
For instance, according to the American Academy of Ophthalmology, in people older than 40 years old, the prevalence of primary open-angle glaucoma (POAG) is 1.86%. POAG prevalence is estimated to be highest among Chinese people, intermediate among Japanese, and lower among Europeans and Indians. In a rural East African population-based study, 3,268 underwent ophthalmic examination. POAG was diagnosed in 3.1%. A hospital-based survey of glaucomas in Ghana reported that the most common form of glaucoma was primary open-angle glaucoma (44.2%).
Angle-closure glaucoma segment is the fastest growing segment in the glaucoma market share
The angle-closure glaucoma segment is the fastest growing segment in the glaucoma market. The angle-closure glaucoma segment's rapid expansion in the glaucoma treatment market can be attributed to greater information about the ailment, advancements in treatment technology, and demographic shifts that result in higher prevalence rates. As healthcare systems adjust to address these problems, investments in research and development will most certainly continue to improve treatment choices available for angle-closure glaucoma.
Geographical Analysis
North America is expected to hold a significant position in the glaucoma market share
North America is expected to hold a significant portion of the global glaucoma market. North America is well known for its advanced healthcare industry. The higher expenditure on healthcare and rising awareness among people, advancement of technologies for glaucoma treatment, and increase in biopharmaceutical establishment across the region are the main factors contributing to the market growth in the region. Moreover, the market players majorly generate their revenue from the region, which is a major contributing factor to the region’s dominance. For instance, AbbVie generated 432 USD million in 2023 for Lumigan (bimatoprost). Nearly 40% of this revenue is from the U.S. market. Moreover, the company generated 272 USD million in the same year for Alphagan a medication used to treat open-angle glaucoma. Among the total revenue, the company has generated approximately 45% from the U.S.
The availability of branded formulations in the U.S. and the revenue generated by the manufacturers act as a key contributor to the region’s dominance. Moreover, the higher prevalence of glaucoma in the region is another factor contributing to market growth in the region. For instance, according to the Centers for Disease Control and Prevention (CDC), Glaucoma is one of the leading causes of blindness in the U.S. and the total prevalent cases account for approximately 3 million cases by 2050, these cases are expected to reach 6.3 million.
Asia Pacific is growing at the fastest pace in the glaucoma market
The Asia Pacific region's rapid increase in the worldwide glaucoma market can be attributed to a number of factors including rising prevalence rates, economic development resulting in greater healthcare access, technical breakthroughs in treatment approaches, and higher public awareness about eye health. As these variables continue to converge, Asia Pacific is projected to strengthen its position as a prominent participant in the global glaucoma treatment landscape.
Market Segmentation
By Type
• Open-Angle Glaucoma
• Angle-Closure Glaucoma
• Congenital Glaucoma
• Others
By Treatment Type
• Prostaglandins
o Bimatoprost
o Latanoprost
o Travoprost
o Others
• Beta Blockers
o Timolol
o Betaxolol
o Others
• Alpha-Adrenergic Agonists
• Carbonic Anhydrase Inhibitors
• Miotics
• Rho Kinase Inhibitors
• Implants
• Others
By Age Group
• Children
• Adults
• Geriatrics
By Distribution Channel
• Hospital Pharmacies
• Retail Pharmacies
• Online Pharmacies
By Region
• North America
o U.S.
o Canada
o Mexico
• Europe
o Germany
o U.K.
o France
o Spain
o Italy
o Rest of Europe
• South America
o Brazil
o Argentina
o Rest of South America
• Asia-Pacific
o China
o India
o Japan
o South Korea
o Rest of Asia-Pacific
• Middle East and Africa
Competitive Landscape
The major global players in the global glaucoma market include Novartis AG, Bausch + Lomb., Viatris Inc., AbbVie., Alcon Inc., Thea Pharma Inc., Pfizer Inc., Santen Pharmaceutical Co., Ltd., Sun Pharmaceutical Industries, Inc., Somerset Pharma LLC among others.
Emerging Players
Metcela Inc., Inspira-Technologies OXY B.H.N. LTD., LIVANOVA PLC among others.
Key Developments
• In October 2024, Spinogenix, Inc., a clinical-stage biopharmaceutical company that pioneers first-in-class therapeutics that restore synapses to improve patients' lives worldwide, announced that it has brought world-leading clinical and research expertise in glaucoma to Spinogenix as the company prepares to launch a new program to evaluate SPG302 as a potential neuroprotective therapeutic for glaucoma. Spinogenix endorses SPG302 as a cutting-edge glaucoma treatment. SPG302 is a small molecule medication in clinical stage that is taken orally and has the unusual capacity to quickly rebuild glutamatergic synapses.
Why Purchase the Report?
• To visualize the global glaucoma market segmentation based on type, treatment type, age group, distribution channel, and region as well as understand key commercial assets and players.
• Identify commercial opportunities by analyzing trends and co-development.
• Excel data sheet with numerous data points of glaucoma market-level with all segments.
• PDF report consists of a comprehensive analysis after exhaustive qualitative interviews and an in-depth study.
• Product mapping available as Excel consisting of key products of all the major players.
The global glaucoma market report would provide approximately 53 tables, 47 figures, and 176 pages.
Target Audience 2023
• Manufacturers/ Buyers
• Industry Investors/Investment Bankers
• Research Professionals
• Emerging Companies
1. Methodology and Scope
1.1. Research Methodology
1.2. Research Objective and Scope of the Report
2. Definition and Overview
3. Executive Summary
3.1. Snippet by Type
3.2. Snippet by Treatment Type
3.3. Snippet by Age Group
3.4. Snippet by Distribution Channel
3.5. Snippet by Region
4. Dynamics
4.1. Impacting Factors
4.1.1. Drivers
4.1.2. Rising Prevalence of Glaucoma
4.1.3. Restraints
4.1.3.1. Availability of Alternate Therapies
4.1.4. Opportunity
4.1.5. Impact Analysis
5. Industry Analysis
5.1. Porter's Five Force Analysis
5.2. Supply Chain Analysis
5.3. Pricing Analysis
5.4. Regulatory Analysis
5.5. Reimbursement Analysis
5.6. Patent Analysis
5.7. SWOT Analysis
5.8. DMI Opinion
6. By Type
6.1. Introduction
6.1.1. Market Size Analysis and Y-o-Y Growth Analysis (%), By Type
6.1.2. Market Attractiveness Index, By Type
6.2. Open-Angle Glaucoma*
6.2.1. Introduction
6.2.2. Market Size Analysis and Y-o-Y Growth Analysis (%)
6.3. Angle-Closure Glaucoma
6.4. Congenital Glaucoma
6.5. Others
7. By Treatment Type
7.1. Introduction
7.1.1. Market Size Analysis and Y-o-Y Growth Analysis (%), By Treatment Type
7.1.2. Market Attractiveness Index, By Treatment Type
7.2. Prostaglandins*
7.2.1. Introduction
7.2.2. Market Size Analysis and Y-o-Y Growth Analysis (%)
7.3. Beta Blockers
7.4. Alpha-Adrenergic Agonists
7.5. Carbonic Anhydrase Inhibitors
7.6. Miotics
7.7. Rho Kinase Inhibitors
7.8. Implants
7.9. Others
8. By Age Group
8.1. Introduction
8.1.1. Market Size Analysis and Y-o-Y Growth Analysis (%), By Age Group
8.1.2. Market Attractiveness Index, By Age Group
8.2. Children*
8.2.1. Introduction
8.2.2. Market Size Analysis and Y-o-Y Growth Analysis (%)
8.3. Adults
8.4. Geriatrics
9. By Distribution Channel
9.1. Introduction
9.1.1. Market Size Analysis and Y-o-Y Growth Analysis (%), By Distribution Channel
9.1.2. Market Attractiveness Index, By Distribution Channel
9.2. Hospital Pharmacies*
9.2.1. Introduction
9.2.2. Market Size Analysis and Y-o-Y Growth Analysis (%)
9.3. Retail Pharmacies
9.4. Online Pharmacies
10. By Region
10.1. Introduction
10.1.1. Market Size Analysis and Y-o-Y Growth Analysis (%), By Region
10.1.2. Market Attractiveness Index, By Region
10.2. North America
10.2.1. Introduction
10.2.2. Key Region-Specific Dynamics
10.2.3. Market Size Analysis and Y-o-Y Growth Analysis (%), By Type
10.2.4. Market Size Analysis and Y-o-Y Growth Analysis (%), By Treatment Type
10.2.5. Market Size Analysis and Y-o-Y Growth Analysis (%), By Age Group
10.2.6. Market Size Analysis and Y-o-Y Growth Analysis (%), By Distribution Channel
10.2.7. Market Size Analysis and Y-o-Y Growth Analysis (%), By Country
10.2.7.1. The U.S.
10.2.7.2. Canada
10.2.7.3. Mexico
10.3. Europe
10.3.1. Introduction
10.3.2. Key Region-Specific Dynamics
10.3.3. Market Size Analysis and Y-o-Y Growth Analysis (%), By Type
10.3.4. Market Size Analysis and Y-o-Y Growth Analysis (%), By Treatment Type
10.3.5. Market Size Analysis and Y-o-Y Growth Analysis (%), By Age Group
10.3.6. Market Size Analysis and Y-o-Y Growth Analysis (%), By Distribution Channel
10.3.7. Market Size Analysis and Y-o-Y Growth Analysis (%), By Country
10.3.7.1. Germany
10.3.7.2. UK
10.3.7.3. France
10.3.7.4. Italy
10.3.7.5. Spain
10.3.7.6. Rest of Europe
10.4. South America
10.4.1. Introduction
10.4.2. Key Region-Specific Dynamics
10.4.3. Market Size Analysis and Y-o-Y Growth Analysis (%), By Type
10.4.4. Market Size Analysis and Y-o-Y Growth Analysis (%), By Treatment Type
10.4.5. Market Size Analysis and Y-o-Y Growth Analysis (%), By Age Group
10.4.6. Market Size Analysis and Y-o-Y Growth Analysis (%), By Distribution Channel
10.4.7. Market Size Analysis and Y-o-Y Growth Analysis (%), By Country
10.4.7.1. Brazil
10.4.7.2. Argentina
10.4.7.3. Rest of South America
10.5. Asia-Pacific
10.5.1. Introduction
10.5.2. Key Region-Specific Dynamics
10.5.3. Market Size Analysis and Y-o-Y Growth Analysis (%), By Type
10.5.4. Market Size Analysis and Y-o-Y Growth Analysis (%), By Treatment Type
10.5.5. Market Size Analysis and Y-o-Y Growth Analysis (%), By Age Group
10.5.6. Market Size Analysis and Y-o-Y Growth Analysis (%), By Distribution Channel
10.5.7. Market Size Analysis and Y-o-Y Growth Analysis (%), By Country
10.5.7.1. China
10.5.7.2. India
10.5.7.3. Japan
10.5.7.4. South Korea
10.5.7.5. Rest of Asia-Pacific
10.6. Middle East and Africa
10.6.1. Introduction
10.6.2. Key Region-Specific Dynamics
10.6.3. Market Size Analysis and Y-o-Y Growth Analysis (%), By Type
10.6.4. Market Size Analysis and Y-o-Y Growth Analysis (%), By Treatment Type
10.6.5. Market Size Analysis and Y-o-Y Growth Analysis (%), By Age Group
10.6.6. Market Size Analysis and Y-o-Y Growth Analysis (%), By Distribution Channel
11. Competitive Landscape
11.1. Competitive Scenario
11.2. Market Positioning/Share Analysis
11.3. Mergers and Acquisitions Analysis
12. Company Profiles
12.1. Novartis AG *
12.1.1. Company Overview
12.1.2. Product Portfolio and Description
12.1.3. Financial Overview
12.1.4. Key Developments
12.2. Bausch + Lomb.
12.3. Viatris Inc.
12.4. AbbVie.
12.5. Alcon Inc.
12.6. Thea Pharma Inc.
12.7. Pfizer Inc.
12.8. Santen Pharmaceutical Co., Ltd.
12.9. Sun Pharmaceutical Industries, Inc.
12.10. Somerset Pharma LLC
LIST NOT EXHAUSTIVE
13. Appendix
13.1. About Us and Services
13.2. Contact Us
❖ 世界の緑内障市場に関するよくある質問(FAQ) ❖
・緑内障の世界市場規模は?
→DataM Intelligence社は2023年の緑内障の世界市場規模を83億6,000万米ドルと推定しています。
・緑内障の世界市場予測は?
→DataM Intelligence社は2031年の緑内障の世界市場規模を127億7,000万米ドルと予測しています。
・緑内障市場の成長率は?
→DataM Intelligence社は緑内障の世界市場が2024年~2031年に年平均5.5%成長すると予測しています。
・世界の緑内障市場における主要企業は?
→DataM Intelligence社は「Novartis AG, Bausch + Lomb., Viatris Inc., AbbVie., Alcon Inc., Thea Pharma Inc., Pfizer Inc., Santen Pharmaceutical Co., Ltd., Sun Pharmaceutical Industries, Inc., Somerset Pharma LLCなど ...」をグローバル緑内障市場の主要企業として認識しています。
※上記FAQの市場規模、市場予測、成長率、主要企業に関する情報は本レポートの概要を作成した時点での情報であり、納品レポートの情報と少し異なる場合があります。


