

1 はじめに 27
1.1 調査目的 27
1.2 市場の定義 27
1.3 調査範囲 28
1.3.1 対象市場 28
1.3.2 調査対象および除外項目 29
1.3.3 考慮した年数 30
1.4 考慮した通貨 30
1.5 単位の検討 31
1.6 制限事項 31
1.7 利害関係者 31
1.8 変更点のまとめ 31
2 調査方法 33
2.1 調査データ 33
2.1.1 二次調査および一次調査 35
2.1.2 二次データ 36
2.1.2.1 主な二次資料 36
2.1.2.2 二次資料の主要データ 36
2.1.3 一次データ 37
2.1.3.1 一次インタビューの対象者 37
2.1.3.2 主要な一次インタビュー参加者 37
2.1.3.3 プライマリーの内訳 37
2.1.3.4 一次資料からの主なデータ 38
2.1.3.5 主要な業界インサイト 39
2.2 市場規模の推定方法 40
2.2.1 ボトムアップアプローチ 40
2.2.1.1 ボトムアップ分析による市場規模算出のアプローチ
(需要側) 41
2.2.2 トップダウンアプローチ 41
2.2.2.1 トップダウン分析による市場規模推計の考え方
(供給側) 42
2.3 データの三角測量 43
2.4 リサーチの前提 44
2.5 調査の限界 44
2.6 リスク評価 44
3 エグゼクティブ・サマリー
4 プレミアムインサイト 49
4.1 イメージセンサー市場におけるプレーヤーにとっての魅力的な機会 49
4.2 イメージセンサー市場、地域別 49
4.3 イメージセンサー市場:解像度別 50
4.4 イメージセンサー市場、スペクトル別 50
4.5 アジア太平洋地域のイメージセンサー市場:用途・国別 51
4.6 イメージセンサー市場:国別 51
5 市場の概要 52
5.1 はじめに 52
5.2 市場ダイナミクス
5.2.1 ドライバー 53
5.2.1.1 車両の安全性、快適性、自動化を強化する ADAS 技術の統合の拡大 53
5.2.1.2 産業、農業、ヘルスケア・アプリケーションにおける IoT デバイスの利用急増 54
5.2.1.3 スマートフォン写真の進歩 54
5.2.2 阻害要因 55
5.2.2.1 イメージセンサー製造に伴う多大なコスト 55
5.2.2.2 イメージセンサーによる高い消費電力 56
5.2.3 機会 57
5.2.3.1 新興市場の成長と多様化 57
5.2.3.2 イメージセンサーと先端技術の融合 58
5.2.3.3 技術進歩に伴うイメージセンサの新しい用途の出現 58
5.2.4 課題 59
5.2.4.1 小型化における画素サイズと光学性能のバランス 59
5.2.4.2 地政学的緊張によるサプライチェーンの混乱 59
5.3 バリューチェーン分析 60
5.4 エコシステム分析 62
5.5 顧客ビジネスに影響を与えるトレンド/混乱 63
5.6 価格分析 64
5.6.1 主要企業が提供するイメージセンサーの指標価格、
タイプ別、2023年 65
5.6.2 イメージセンサの平均販売価格動向(タイプ別):2020~2023年 66
5.6.3 CMOSイメージセンサーの地域別平均販売価格動向(2020~2023年) 67
5.7 技術分析 68
5.7.1 主要技術 68
5.7.1.1 Cu-Cu接続の積層型CMOSイメージセンサー 68
5.7.2 補完技術 68
5.7.2.1 カラムA/Dコンバータ付きCMOSセンサ 68
5.7.3 隣接技術 68
5.7.3.1 裏面照射型CMOSセンサー 68
5.8 ポーターの5つの力分析 69
5.8.1 新規参入の脅威 70
5.8.2 代替品の脅威 70
5.8.3 供給者の交渉力 70
5.8.4 買い手の交渉力 70
5.8.5 競争相手の強さ 70
5.9 主要ステークホルダーと購買基準 71
5.9.1 購入プロセスにおける主要ステークホルダー 71
5.9.2 購買基準 72
5.10 ケーススタディ分析 73
5.10.1 ビバモスは医療分野で手術やコーンビームCT(コンピュータ断層撮影)用のCMOSセンサーを提供 73
5.10.2 JRCS、海上ナビゲーションにAIベースの物体認識システムを提供 73
5.10.3 リリン、ソニーとの協業により、老人ホーム入居者の安全性向上とプライバシ ー維持のためのTofセンサー搭載見守りカメラを提供 74
5.10.4 ソニー、高解像度画像の撮影と飛行時間の延長を実現するドローン用先進画像センシングカメラを提供 74
5.11 投資と資金調達のシナリオ 75
5.12 貿易分析 76
5.12.1 輸入シナリオ(HSコード854140) 76
5.12.2 輸出シナリオ(HSコード854140) 77
5.13 特許分析 78
5.14 主要会議・イベント(2024-2025年) 81
5.15 規制の状況 82
5.15.1 規制機関、政府機関、その他の団体 82
5.15.2 標準規格と規制 84
5.16 人工知能がイメージセンサー市場に与える影響 86
5.16.1 トップのユースケース 86
5.16.2 ソニーセミコンダクタソリューションズ株式会社によるAIセンサーのユースケース 88
5.16.3 AIとml技術のイメージセンサーへの統合 88
6 イメージセンサのアナログ出力とデジタル出力 89
6.1 はじめに
6.2 アナログ 89
6.3 デジタル 89
7 異なる技術に基づくイメージセンサー 90
7.1 はじめに
7.2 ローリングシャッターセンサー
7.3 グローバルリセットレリーズ(Grr)センサー 91
7.4 グローバルシャッターセンサー 91
7.5 偏光センサー 92
7.6 紫外線センサー 93
7.7 短波長赤外センサー(Swir) 93
7.8 飛行時間(TOF)センサー 94
7.9 イベントベースビジョン(EVS)センサー 95
7.10 マルチスペクトルセンサー
8 イメージセンサー市場、タイプ別 97
8.1 はじめに 98
8.2 CMOS 100
8.2.1 費用対効果と柔軟性が需要を押し上げる 100
8.3 CCD 101
8.3.1 高い消費電力と読み出し速度の遅さが普及を制限 101
8.4 その他のタイプ 102
9 イメージセンサー市場:処理技術別 104
9.1 導入 105
9.2 2D 106
9.2.1 スマートフォンや監視システムにおける高解像度カメラの使用が市場を牽引 106
9.3 3D 107
9.3.1 高画質画像への需要の高まりが市場成長を支える 107
10 イメージセンサー市場(スペクトル別) 108
10.1 はじめに 109
10.2 可視 110
10.2.1 高感度・高詳細性よりも色情報が重視されないアプリケーションでの採用拡大が市場成長を加速 110
10.2.2 モノクロ(モノ)イメージセンサー 111
10.2.3 カラーイメージセンサー 111
10.3 非可視領域 112
10.3.1 見えない情報を検知・分析するヘルスケア、車載、セキュリティ用途の増加が市場を牽引 112
10.3.2 NIR&SWIRイメージセンサー 113
10.3.3 MWIRイメージセンサー 113
10.3.4 LWIRイメージセンサー 113
10.3.5 X線イメージセンサー 114
11 イメージングタイプ別イメージセンサー市場 115
11.1 はじめに 116
11.2 デジタルイメージング 117
11.2.1 スマートフォン、デジタルカメラ、医療用スキャナーの需要増加がセグメント成長を促進 117
11.3 赤外線イメージング 117
11.3.1 セキュリティ・監視分野での赤外線イメージング技術の需要増加が市場を牽引 117
11.3.2 赤外線イメージセンサー 117
11.3.3 赤外線イメージセンサー 118
11.3.4 ハイパースペクトル画像センサー 118
12 イメージセンサー市場:アレイタイプ別 119
12.1 導入 120
12.2 ラインスキャン 121
12.2.1 移動体の精密検査ニーズの高まりがセグメント成長を後押し 121
12.3 エリアスキャン 122
12.3.1 科学研究用途と医療画像用途がセグメント成長に最も寄与 122
13 イメージセンサー市場:解像度別 123
13.1 はじめに 124
13.2 0.3 mp 125
13.2.1 シンプルさ、効率性、コンパクト設計がセグメント成長を支える 125
13.3 1.3~3mp 126
13.3.1 費用対効果の高い低電力センサーへの需要の高まりがセグメント成長に寄与 126
13.4 5~10MP 126
13.4.1 マシンビジョンシステムとアダスの採用が増加し、セグメント成長を促進 126
13.5 12~16MP 127
13.5.1 高画質ビデオ監視システムとAR/VR システムの導入急増がセグメント成長を加速 127
13.6 16MP以上 127
13.6.1 エレクトロニクス、自動車、製造業における欠陥検出と高品質製品への注力の高まりが市 場を牽引 127
14 イメージセンサー市場、用途別 128
14.1 はじめに 129
14.2 自動車 131
14.2.1 アダスや自律走行車への需要の高まりが市場を牽引 131
14.2.2 リアビューカメラとサイドビューカメラ 134
14.2.3 前方視認型アダス 135
14.2.4 車載用アダス 135
14.2.5 カメラミラーシステム 135
14.3 民生用電子機器 136
14.3.1 スマートフォン&タブレット 141
14.3.1.1 洗練された軽量スマートフォン・タブレットへの需要急増が市場成長を加速 141
14.3.2 デスクトップ&ラップトップ 141
14.3.2.1 バーチャル・ミーティングやビデオ会議の増加傾向が需要を押し上げる 141
14.3.3 業務用複写機・スキャナー 142
14.3.3.1 よりクリーンなコピーを実現するためのシャッター技術に基づくイメージセンサの使用が増加し、市場を牽引 142
14.3.4 写真・ビデオ用カメラ 142
14.3.4.1 ノイズを低減し色精度を向上させる先進的センサーの能力により、プロ 用映画用カメラでの採用が増加 142
14.3.5 ウェアラブル 142
14.3.5.1 成長著しいゲーム産業が有利な機会を生み出す 142
14.3.6 業務用ドローン 143
14.3.6.1 作物の健康状態を監視し、灌漑の必要性を特定するためのドローンの利用が増加し、市場成長を促進 143
14.3.7 ロボット 144
14.3.7.1 ロボット掃除機の需要増加が市場成長を促進 144
14.3.8 スマートホームデバイス 144
14.3.8.1 よりスマートで安全、効率的な住宅の開発により高度な画像センサーの需要が増加 144
14.4 医療・ライフサイエンス 145
144.4.1 顕微鏡検査とデジタル病理検査における高度画像処理への需要拡大が市場成長を支える 145
14.4.2 X線 149
14.4.3 内視鏡検査 149
14.5 産業用 149
14.5.1 自動化と品質管理への注目の高まりが市場成長を促進 149
14.5.2 マシンビジョン 153
14.5.3 ロボットビジョン 153
14.6 商業用 153
14.6.1 小売業における自動化の急増で画像センサーの需要が急増 153
14.7 セキュリティ・監視 157
14.7.1 顔認識、ナンバープレート読み取り、その他の法医学アプリケーションのためのセキュリ ティカメラの導入拡大が市場を牽引 157
14.8 航空宇宙・防衛 161
14.8.1 効果的な状況認識のための監視・偵察ソリューションへの要求の高まりがイメージセンサー需要を促進 161
15 イメージセンサー市場(地域別) 165
15.1 はじめに 166
15.2 北米 168
15.2.1 北米のマクロ経済見通し 168
15.2.2 米国 171
15.2.2.1 家電産業の繁栄が市場を牽引 171
15.2.3 カナダ 172
15.2.3.1 政府主導のインフラ整備資金が市場成長に寄与 172
15.2.4 メキシコ 173
15.2.4.1 自動車産業が市場成長を促進 173
15.3 欧州 175
15.3.1 欧州のマクロ経済見通し 175
15.3.2 イギリス 178
15.3.2.1 高級車メーカーの存在感が市場成長を促進 178
15.3.3 ドイツ 179
15.3.3.1 自動車、医療、産業分野での高解像度カメラ採用の増加が市場成長を加速 179
15.3.4 フランス 181
15.3.4.1 電気自動車と自律走行車の需要増加が市場成長に寄与 181
15.3.5 その他のヨーロッパ 182
15.4 アジア太平洋 183
15.4.1 アジア太平洋地域のマクロ経済見通し 183
15.4.2 中国 186
15.4.2.1 政府主導のインフラ投資と公共セキュリティ・プロジェクトが市場成長を促進 186
15.4.3 日本 187
15.4.3.1 セキュリティ・ソリューションの急増が市場を牽引 187
15.4.4 インド 189
15.4.4.1 スマートシティ構想の導入が市場成長に寄与 189
15.4.5 その他のアジア太平洋地域 190
15.5 ROW 191
15.5.1 列国のマクロ経済見通し 191
15.5.2 中東 194
15.5.2.1 進行中のスマートシティプロジェクトが市場成長を促進 194
15.5.2.2 GCC諸国 196
15.5.2.3 その他の中東地域 196
15.5.3 アフリカ 196
15.5.3.1 監視イニシアチブへの注目の高まりが市場を牽引 196
15.5.4 南米 197
15.5.4.1 家電産業の成長による機会創出 197
16 競争環境
16.1 概要 199
16.2 主要プレーヤーの戦略/勝利への権利(2020~2024年) 199
16.3 市場シェア分析(2023年) 201
16.4 収益分析、2019-2023 202
16.5 企業評価と財務指標(2024年
16.6 ブランド/製品の比較 206
16.7 企業評価マトリックス:主要企業、2023年 207
16.7.1 スター企業 207
16.7.2 新興リーダー 207
16.7.3 浸透型プレーヤー 207
16.7.4 参加企業 207
16.7.5 企業フットプリント:主要プレーヤー(2023年
16.7.5.1 企業フットプリント 209
16.7.5.2 地域別フットプリント 210
16.7.5.3 タイプ別フットプリント 211
16.7.5.4 スペクトラム別フットプリント 212
16.7.5.5 アプリケーション・フットプリント 213
16.8 企業評価マトリクス:新興企業/SM(2023年) 214
16.8.1 進歩的企業 214
16.8.2 対応力のある企業 214
16.8.3 ダイナミックな企業 214
16.8.4 スタートアップ・ブロック 214
16.8.5 競争ベンチマーキング:新興企業/SM(2023年) 216
16.8.5.1 主要新興企業/中小企業の詳細リスト 216
16.8.5.2 主要新興企業/中小企業の競合ベンチマーキング 217
16.9 競争シナリオ 218
16.9.1 製品上市 218
16.9.2 取引 219
17 企業プロファイル 221
Sony Corporation (Japan)
Samsung. (South Korea)
Omnivision (US)
Semiconductor Components Industries
LLC (US) and STMicroelectronics (Switzerland)
18 付録 276
18.1 業界専門家による洞察 276
18.2 ディスカッションガイド 277
18.3 Knowledgestore: Marketsandmarketsの購読ポータル 280
18.4 カスタマイズオプション 282
18.5 関連レポート 282
18.6 著者の詳細 283
High-quality performance, cost-effectiveness, and versatility across a broad range of applications are to make CMOS sensors claim the largest market share of image sensors in the forecast period. Compared with CCD sensors, CMOS technology has some significant advantages. It has lower power consumption, faster readout speed, and the possibility to integrate other functionalities directly into the sensor chip. The above integration helps for in-chip processing along with increased image quality. Hence, CMOS sensors are so attractive that they range from smartphone cameras to automotive systems and security cameras. Demand is further boosted because of high-resolution imaging demands in consumer electronics, a trend encouraged by enhanced smartphone cameras and digital photography. The smart home technology and IoT applications, which deploy efficient and compact imaging solutions where CMOS sensors excel, are another primary driver. Automotive is another critical driver, given that these sensors are increasingly employed in ADAS for object detection and lane keeping. That is, the continued innovation in enhancing CMOS sensors' capabilities will continue pushing the acceptance of these devices across industries such as healthcare, industrial automation, and entertainment, thus sustaining high growth and increasing market share for CMOS technology leaders.
“12 MP to 16 MP segment by reolution is projected to have highest CAGR during theforecast period.”
CAGR in the image sensor market is expected to be maximum for the 12-16 MP resolution range. There seems to be a sweet spot that 12-16 MP achieves for many applications: high-quality images without excessive processing demands and costs. In consumer electronics, especially in smartphones and digital cameras, manufacturers are putting 12 MP to 16 MP sensors to fulfill the expectation of consumers about clear, detailed images within manageable file sizes. Further, the rise in content creation and social media has increased demand for devices equipped with capable imaging technology. These sensors are also finding more inroads in newer applications such as security and surveillance, where high-resolution images help monitor and identify effectively. Industrial needs are required to enable detailed images for applications like quality control and machine vision. More importantly, better low-light performance and speedier processing speeds, among other advancements, are propelling the capabilities of 12 MP and 16 MP sensors. Consequently, this resolution segment is expected to see healthy growth, representing market trends and user needs evolving.
“Area scan image sensors by array type to have the highest market share in image sensor market during the forecast period.”
The area scan image sensors are expected to have the largest market share in the future for image sensors. The reason is that these types of sensors are versatile and applicable everywhere, regardless of the industry sector. Area scan image sensors capture an entire image at once. They can be highly used in various applications, such as industrial automation, medical imaging, and security surveillance. Recently, these area scan sensors have found use in many machine vision applications, such as enabling precision in inspection and quality assessment of the object detected through higher productivity. Industry 4.0 has increased the speed of smart manufacturing solutions and increased the requirement for area scan image sensors, which are more capable of delivering high-resolution images with consistent, therefore,under changing conditions. Moreover, improvements in sensor technology, such as higher frame rates and better sensitivity, have opened new fields of application for area scan sensors to be integrated into cutting-edge applications like robotics and autonomous systems. Increased emphasis on automation and quality control across industries will boost area scan image sensor demand considerably in the future. The increasing trend will place area scan sensors in an advantageous position in the market, where they will corner the biggest share of the market in the future.
“Commercial sector to account for second-highest CAGR in image sensor market during the forecast period.”
The commercial sector will be the second-highest contributor to the CAGR in the image sensor market, mainly due to the burgeoning demand for security and surveillance solutions. In light of the growing need for security and protection, businesses operating in various industries have resulted in the requirement to use advanced imaging technologies for facility, asset, and human resource monitoring. High-resolution video surveillance is made possible through image sensors, permitting real-time monitoring and improved response to incidents. In addition, growth in smart retail environments has increased the demand for image sensors. Retailers apply cameras for inventory management, customer behavior analysis, and loss prevention. These applications increase operational efficiency and enhance customer experience through personalized marketing strategies. Integration with AI and image sensors provides advanced analytics such as facial recognition and demographic analysis, which are of great value in targeted advertising and enhancing customer engagement. Commercial space digital transformation requires high-quality imaging solutions to create a trend; all these factors put the commercial sector on the pathway of major expansion in image sensor markets and show that the industry as shifting towards more intelligent, data-driven operations.
“North American region growing at a high CAGR during the forecast period.”
North America is expected to grow significantly with a high compound annual growth rate over the forecast period. This is attributed to the importance of the region in the adoption of technological innovation and research and development. North America is home to major technology firms and startups, making it a front-liner for the developments made in imaging technologies, thereby driving the demand for high-performance sensors across applications. Further growth adoption is observed in automotive, healthcare, and consumer electronics. Advanced imaging solutions in the automotive industry are required for safety and navigation purposes with advanced driver assistance systems and autonomous vehicles. Advanced sensors in medical devices with high-resolution imaging in diagnostics drive the need of the healthcare sector. In addition, demand for smart home technologies and security systems is also propelling image sensors in residential applications.. With increased usage of AI and machine learning with imaging solutions that improve functionality and performance, growth in the market continues to increase. In the coming years, North America is going to be one of the primary drivers in the image sensor market with many prospects in terms of high growth.
The study contains insights from various industry experts, from component suppliers to Tier 1 companies and OEMs. The break-up of the primaries is as follows:
• By Company Type: Tier 1 – 55%, Tier 2 – 25%, and Tier 3 – 20%
• By Designation: Directors – 50%, Managers – 30%, and Others – 20%
• By Region: North America – 40%, Europe – 35%, Asia Pacific – 20%, and RoW – 5%
The key players operating in the image sensor market are Sony Corporation (Japan), Samsung. (South Korea), Omnivision (US), Semiconductor Components Industries, LLC (US) and STMicroelectronics (Switzerland), and others.
Research Coverage: The research reports the image sensor market has been segmented based on type, by processing technique, by spectrum, by imaging type, by array type, by resolution, by end user and by region. Based on type the market has been segmented into CMOS, CCD and other which further includes hybrid and infrared. The market for processing technique has been segmented into 2D and 3D image sensors. The market by spectrum has been segmented into visible spectrum and infrared spectrum. By imaging type the market has been segmented into digital and IR imaging, which is further divided into infrared, thermal and hyperspectral. By array type the market has been divided into Linear and Area. By resolution the market has been segmented by VGA, 1.3 MP to 3 MP, 5 MP to 10 MP, 12 MP to 16 MP, and more than 16 MP. The market by end user has been segmented into automotive, consumer electronics, medical and life sciences, industrial, commercial, security and surveillance, and aerospace and defence. The market by region has been segmented into North America, Europe, Asia Pacific, and RoW.
The scope of the report covers detailed information regarding the major factors, such as drivers, restraints, challenges, and opportunities, influencing the growth of the retail automation market. A detailed analysis of the key industry players has been done to provide insights into their business overviews, products, key strategies, contracts, partnerships, and agreements. New product & and service launches, mergers and acquisitions, and recent developments associated with the image sensor market have been covered in the report. This report covers a competitive analysis of upcoming startups in the image sensor market ecosystem.
Key Benefits of Buying the Report
Analysis of key drivers (Adoption of ADAS in automotive, RRise of IoT), restraints (High Manufacturing Costs, Size and Weight Constraints), opportunities (Integration with Other Technologies, Emerging Markets), and challenges (Optical and Performance Constraints of Pixel Miniaturization, Supply Chain Disruptions) influencing the growth of the image sensor market.
•Product Development/Innovation: Detailed insights on upcoming technologies, research and development activities, and new product launches in the image sensor market.
•Market Development: Comprehensive information about lucrative markets – the report analyses the image sensor market across varied regions.
•Market Diversification: Exhaustive information about new products/services, untapped geographies, recent developments, and investments in the image sensor market.
•Competitive Assessment: In-depth assessment of market shares, growth strategies, and service offerings of leading players like Sony Corporation (Japan), Samsung. (South Korea), Omnivision (US), Semiconductor Components Industries, LLC (US) and STMicroelectronics (Switzerland), and others etc.
1 INTRODUCTION 27
1.1 STUDY OBJECTIVES 27
1.2 MARKET DEFINITION 27
1.3 STUDY SCOPE 28
1.3.1 MARKETS COVERED 28
1.3.2 INCLUSIONS AND EXCLUSIONS 29
1.3.3 YEARS CONSIDERED 30
1.4 CURRENCY CONSIDERED 30
1.5 UNIT CONSIDERED 31
1.6 LIMITATIONS 31
1.7 STAKEHOLDERS 31
1.8 SUMMARY OF CHANGES 31
2 RESEARCH METHODOLOGY 33
2.1 RESEARCH DATA 33
2.1.1 SECONDARY AND PRIMARY RESEARCH 35
2.1.2 SECONDARY DATA 36
2.1.2.1 Major secondary sources 36
2.1.2.2 Key data from secondary sources 36
2.1.3 PRIMARY DATA 37
2.1.3.1 Intended participants in primary interviews 37
2.1.3.2 Key primary interview participants 37
2.1.3.3 Breakdown of primaries 37
2.1.3.4 Key data from primary sources 38
2.1.3.5 Key industry insights 39
2.2 MARKET SIZE ESTIMATION METHODOLOGY 40
2.2.1 BOTTOM-UP APPROACH 40
2.2.1.1 Approach to arrive at market size using bottom-up analysis
(demand side) 41
2.2.2 TOP-DOWN APPROACH 41
2.2.2.1 Approach to arrive at market size using top-down analysis
(supply side) 42
2.3 DATA TRIANGULATION 43
2.4 RESEARCH ASSUMPTIONS 44
2.5 RESEARCH LIMITATIONS 44
2.6 RISK ASSESSMENT 44
3 EXECUTIVE SUMMARY 45
4 PREMIUM INSIGHTS 49
4.1 ATTRACTIVE OPPORTUNITIES FOR PLAYERS IN IMAGE SENSOR MARKET 49
4.2 IMAGE SENSOR MARKET, BY REGION 49
4.3 IMAGE SENSOR MARKET, BY RESOLUTION 50
4.4 IMAGE SENSOR MARKET, BY SPECTRUM 50
4.5 IMAGE SENSOR MARKET IN ASIA PACIFIC, BY APPLICATION AND COUNTRY 51
4.6 IMAGE SENSOR MARKET, BY COUNTRY 51
5 MARKET OVERVIEW 52
5.1 INTRODUCTION 52
5.2 MARKET DYNAMICS 52
5.2.1 DRIVERS 53
5.2.1.1 Growing integration of ADAS technologies to enhance vehicle safety, comfort, and automation 53
5.2.1.2 Surging use of IoT devices in industrial, agriculture, and healthcare applications 54
5.2.1.3 Advancements in smartphone photography 54
5.2.2 RESTRAINTS 55
5.2.2.1 Substantial costs associated with image sensor manufacturing 55
5.2.2.2 High power consumption by image sensors 56
5.2.3 OPPORTUNITIES 57
5.2.3.1 Growth and diversification of emerging markets 57
5.2.3.2 Integration of image sensors with advanced technologies 58
5.2.3.3 Emergence of newer applications of image sensors with technological advancements 58
5.2.4 CHALLENGES 59
5.2.4.1 Balancing pixel size with optical performance during miniaturization 59
5.2.4.2 Supply chain disruptions due to geopolitical tensions 59
5.3 VALUE CHAIN ANALYSIS 60
5.4 ECOSYSTEM ANALYSIS 62
5.5 TRENDS/DISRUPTIONS IMPACTING CUSTOMER BUSINESS 63
5.6 PRICING ANALYSIS 64
5.6.1 INDICATIVE PRICING OF IMAGE SENSORS PROVIDED BY KEY PLAYERS,
BY TYPE, 2023 65
5.6.2 AVERAGE SELLING PRICE TREND OF IMAGE SENSORS, BY TYPE, 2020–2023 66
5.6.3 AVERAGE SELLING PRICE TREND OF CMOS IMAGE SENSORS, BY REGION, 2020–2023 67
5.7 TECHNOLOGY ANALYSIS 68
5.7.1 KEY TECHNOLOGIES 68
5.7.1.1 Stacked CMOS image sensors with Cu-Cu connections 68
5.7.2 COMPLEMENTARY TECHNOLOGIES 68
5.7.2.1 CMOS sensors with column A/D converter 68
5.7.3 ADJACENT TECHNOLOGIES 68
5.7.3.1 Back-illuminated CMOS sensors 68
5.8 PORTER’S FIVE FORCES ANALYSIS 69
5.8.1 THREAT OF NEW ENTRANTS 70
5.8.2 THREAT OF SUBSTITUTES 70
5.8.3 BARGAINING POWER OF SUPPLIERS 70
5.8.4 BARGAINING POWER OF BUYERS 70
5.8.5 INTENSITY OF COMPETITIVE RIVALRY 70
5.9 KEY STAKEHOLDERS AND BUYING CRITERIA 71
5.9.1 KEY STAKEHOLDERS IN BUYING PROCESS 71
5.9.2 BUYING CRITERIA 72
5.10 CASE STUDY ANALYSIS 73
5.10.1 VIVAMOS OFFERS CMOS SENSOR TO CARRY OUT SURGERY AND CONE-BEAM COMPUTED TOMOGRAPHY IN MEDICAL FIELD 73
5.10.2 JRCS PROVIDES AI-BASED OBJECT RECOGNITION SYSTEM FOR MARITIME NAVIGATION 73
5.10.3 LILIN, IN COLLABORATION WITH SONY, OFFERS TOF SENSOR-EQUIPPED MONITORING CAMERA TO IMPROVE SAFETY AND MAINTAIN PRIVACY OF NURSING HOME RESIDENTS 74
5.10.4 SONY PROVIDES ADVANCED IMAGE-SENSING CAMERA FOR DRONE APPLICATIONS TO CAPTURE HIGH-RESOLUTION IMAGES AND MAINTAIN LONGER FLIGHT TIMES 74
5.11 INVESTMENT AND FUNDING SCENARIO 75
5.12 TRADE ANALYSIS 76
5.12.1 IMPORT SCENARIO (HS CODE 854140) 76
5.12.2 EXPORT SCENARIO (HS CODE 854140) 77
5.13 PATENT ANALYSIS 78
5.14 KEY CONFERENCES AND EVENTS, 2024–2025 81
5.15 REGULATORY LANDSCAPE 82
5.15.1 REGULATORY BODIES, GOVERNMENT AGENCIES, AND OTHER ORGANIZATIONS 82
5.15.2 STANDARDS AND REGULATIONS 84
5.16 IMPACT OF ARTIFICIAL INTELLIGENCE ON IMAGE SENSOR MARKET 86
5.16.1 TOP USE CASES 86
5.16.2 AI SENSOR USE CASE BY SONY SEMICONDUCTOR SOLUTIONS CORPORATION 88
5.16.3 INTEGRATION OF AI AND ML TECHNOLOGIES INTO IMAGE SENSORS 88
6 ANALOG AND DIGITAL OUTPUT OF IMAGE SENSORS 89
6.1 INTRODUCTION 89
6.2 ANALOG 89
6.3 DIGITAL 89
7 IMAGE SENSORS BASED ON DIFFERENT TECHNOLOGIES 90
7.1 INTRODUCTION 90
7.2 ROLLING SHUTTER SENSOR 90
7.3 GLOBAL RESET RELEASE (GRR) SENSOR 91
7.4 GLOBAL SHUTTER SENSOR 91
7.5 POLARIZATION SENSOR 92
7.6 ULTRAVIOLET (UV) SENSOR 93
7.7 SHORT-WAVE INFRARED (SWIR) SENSOR 93
7.8 TIME-OF-FLIGHT (TOF) SENSOR 94
7.9 EVENT-BASED VISION (EVS) SENSOR 95
7.10 MULTISPECTRAL SENSOR 95
8 IMAGE SENSOR MARKET, BY TYPE 97
8.1 INTRODUCTION 98
8.2 CMOS 100
8.2.1 COST-EFFECTIVENESS AND FLEXIBILITY ATTRIBUTES TO BOOST DEMAND 100
8.3 CCD 101
8.3.1 HIGH POWER CONSUMPTION AND SLOW READOUT SPEED TO LIMIT ADOPTION 101
8.4 OTHER TYPES 102
9 IMAGE SENSOR MARKET, BY PROCESSING TECHNIQUE 104
9.1 INTRODUCTION 105
9.2 2D 106
9.2.1 INCREASING USE OF HIGH-RESOLUTION CAMERAS IN SMARTPHONES AND SURVEILLANCE SYSTEMS TO DRIVE MARKET 106
9.3 3D 107
9.3.1 SURGING DEMAND FOR HIGH-QUALITY IMAGING TO SUPPORT MARKET GROWTH 107
10 IMAGE SENSOR MARKET, BY SPECTRUM 108
10.1 INTRODUCTION 109
10.2 VISIBLE 110
10.2.1 GROWING ADOPTION IN APPLICATIONS WHERE COLOR INFORMATION IS LESS IMPORTANT THAN HIGH SENSITIVITY AND DETAIL TO ACCELERATE MARKET GROWTH 110
10.2.2 MONOCHROME (MONO) IMAGE SENSOR 111
10.2.3 COLOR IMAGE SENSOR 111
10.3 NON-VISIBLE 112
10.3.1 INCREASING USE IN HEALTHCARE, AUTOMOTIVE, AND SECURITY APPLICATIONS TO DETECT AND ANALYZE INVISIBLE INFORMATION TO DRIVE MARKET 112
10.3.2 NIR & SWIR IMAGE SENSOR 113
10.3.3 MWIR IMAGE SENSOR 113
10.3.4 LWIR IMAGE SENSOR 113
10.3.5 X-RAY IMAGE SENSOR 114
11 IMAGE SENSOR MARKET, BY IMAGING TYPE 115
11.1 INTRODUCTION 116
11.2 DIGITAL IMAGING 117
11.2.1 RISING DEMAND FOR SMARTPHONES, DIGITAL CAMERAS, AND MEDICAL SCANNERS TO FUEL SEGMENTAL GROWTH 117
11.3 INFRARED IMAGING 117
11.3.1 INCREASING DEMAND FOR IR IMAGING TECHNOLOGY FROM SECURITY & SURVEILLANCE TO DRIVE MARKET 117
11.3.2 IR IMAGE SENSOR 117
11.3.3 THERMAL IMAGE SENSOR 118
11.3.4 HYPERSPECTRAL IMAGE SENSOR 118
12 IMAGE SENSOR MARKET, BY ARRAY TYPE 119
12.1 INTRODUCTION 120
12.2 LINE SCAN 121
12.2.1 RISING NEED FOR PRECISE INSPECTION OF MOVING OBJECTS TO BOOST SEGMENTAL GROWTH 121
12.3 AREA SCAN 122
12.3.1 SCIENTIFIC RESEARCH AND MEDICAL IMAGING APPLICATIONS TO CONTRIBUTE MOST TO SEGMENTAL GROWTH 122
13 IMAGE SENSOR MARKET, BY RESOLUTION 123
13.1 INTRODUCTION 124
13.2 0.3 MP 125
13.2.1 SIMPLICITY, EFFICIENCY, AND COMPACT DESIGN TO SUPPORT SEGMENTAL GROWTH 125
13.3 1.3 TO 3 MP 126
13.3.1 INCREASING DEMAND FOR COST-EFFECTIVE AND LOW-POWER SENSORS TO CONTRIBUTE TO SEGMENTAL GROWTH 126
13.4 5 TO 10 MP 126
13.4.1 ELEVATING ADOPTION OF MACHINE VISION SYSTEMS AND ADAS TO FOSTER SEGMENTAL GROWTH 126
13.5 12 TO 16 MP 127
13.5.1 SURGING DEPLOYMENT OF HIGH-QUALITY VIDEO SURVEILLANCE AND AR/VR SYSTEMS TO ACCELERATE SEGMENTAL GROWTH 127
13.6 MORE THAN 16 MP 127
13.6.1 GROWING FOCUS OF ELECTRONICS, AUTOMOTIVE, AND MANUFACTURING COMPANIES ON DEFECT DETECTION AND HIGH PRODUCT QUALITY TO DRIVE MARKET 127
14 IMAGE SENSOR MARKET, BY APPLICATION 128
14.1 INTRODUCTION 129
14.2 AUTOMOTIVE 131
14.2.1 INCREASING DEMAND FOR ADAS AND AUTONOMOUS VEHICLES TO DRIVE MARKET 131
14.2.2 REAR- AND SIDE-VIEW CAMERAS 134
14.2.3 FORWARD-LOOKING ADAS 135
14.2.4 IN-CABIN ADAS 135
14.2.5 CAMERA MIRROR SYSTEMS 135
14.3 CONSUMER ELECTRONICS 136
14.3.1 SMARTPHONES & TABLETS 141
14.3.1.1 Surging demand for sleek and lightweight smartphones and tablets to accelerate market growth 141
14.3.2 DESKTOPS & LAPTOPS 141
14.3.2.1 Growing trend of virtual meetings and video conferencing to boost demand 141
14.3.3 COMMERCIAL COPIER MACHINES & SCANNERS 142
14.3.3.1 Rising use of shutter technology-based image sensors to achieve cleaner copies to drive market 142
14.3.4 PHOTOGRAPHY & VIDEOGRAPHY CAMERAS 142
14.3.4.1 Ability of advanced sensors to reduce noise and enhance color accuracy to increase adoption in professional filmmaking cameras 142
14.3.5 WEARABLES 142
14.3.5.1 Thriving gaming industry to create lucrative opportunities 142
14.3.6 COMMERCIAL DRONES 143
14.3.6.1 Elevating use of drones to monitor crop health and identify irrigation needs to foster market growth 143
14.3.7 ROBOTS 144
14.3.7.1 Rising demand for robotic vacuum cleaners to fuel market growth 144
14.3.8 SMART HOME DEVICES 144
14.3.8.1 Development of smarter, safer, and more efficient homes to increase demand for advanced image sensors 144
14.4 MEDICAL & LIFE SCIENCES 145
14.4.1 GROWING DEMAND FOR ADVANCED IMAGING IN MICROSCOPY AND DIGITAL PATHOLOGY TO SUPPORT MARKET GROWTH 145
14.4.2 X-RAY 149
14.4.3 ENDOSCOPY 149
14.5 INDUSTRIAL 149
14.5.1 INCREASING FOCUS ON AUTOMATION AND QUALITY CONTROL TO AUGMENT MARKET GROWTH 149
14.5.2 MACHINE VISION 153
14.5.3 ROBOTIC VISION 153
14.6 COMMERCIAL 153
14.6.1 SURGING AUTOMATION IN RETAIL SECTOR TO SPIKE DEMAND FOR IMAGE SENSORS 153
14.7 SECURITY & SURVEILLANCE 157
14.7.1 GROWING DEPLOYMENT OF SECURITY CAMERAS FOR FACIAL RECOGNITION, LICENSE PLATE READING, AND OTHER FORENSIC APPLICATIONS TO PROPEL MARKET 157
14.8 AEROSPACE & DEFENSE 161
14.8.1 INCREASING REQUIREMENT FOR SURVEILLANCE AND RECONNAISSANCE SOLUTIONS FOR EFFECTIVE SITUATIONAL AWARENESS TO SPUR DEMAND FOR IMAGE SENSORS 161
15 IMAGE SENSOR MARKET, BY REGION 165
15.1 INTRODUCTION 166
15.2 NORTH AMERICA 168
15.2.1 MACROECONOMIC OUTLOOK FOR NORTH AMERICA 168
15.2.2 US 171
15.2.2.1 Thriving consumer electronics industry to drive market 171
15.2.3 CANADA 172
15.2.3.1 Government-led funding for infrastructure development to contribute to market growth 172
15.2.4 MEXICO 173
15.2.4.1 Thriving automotive sector to fuel market growth 173
15.3 EUROPE 175
15.3.1 MACROECONOMIC OUTLOOK FOR EUROPE 175
15.3.2 UK 178
15.3.2.1 Prominent presence of premium vehicle companies to foster market growth 178
15.3.3 GERMANY 179
15.3.3.1 Increasing adoption of high-resolution cameras in automotive, medical, and industrial sectors to accelerate market growth 179
15.3.4 FRANCE 181
15.3.4.1 Rising demand for electric and autonomous vehicles to contribute to market growth 181
15.3.5 REST OF EUROPE 182
15.4 ASIA PACIFIC 183
15.4.1 MACROECONOMIC OUTLOOK FOR ASIA PACIFIC 183
15.4.2 CHINA 186
15.4.2.1 Government-led investments in infrastructure and public security projects to fuel market growth 186
15.4.3 JAPAN 187
15.4.3.1 Surging deployment of security solutions to drive market 187
15.4.4 INDIA 189
15.4.4.1 Introduction of smart city initiatives to contribute to market growth 189
15.4.5 REST OF ASIA PACIFIC 190
15.5 ROW 191
15.5.1 MACROECONOMIC OUTLOOK FOR ROW 191
15.5.2 MIDDLE EAST 194
15.5.2.1 Ongoing smart city projects to fuel market growth 194
15.5.2.2 GCC countries 196
15.5.2.3 Rest of Middle East 196
15.5.3 AFRICA 196
15.5.3.1 Increasing focus on surveillance initiatives to drive market 196
15.5.4 SOUTH AMERICA 197
15.5.4.1 Growing consumer electronics industry to create opportunities 197
16 COMPETITIVE LANDSCAPE 199
16.1 OVERVIEW 199
16.2 KEY PLAYER STRATEGIES/RIGHT TO WIN, 2020–2024 199
16.3 MARKET SHARE ANALYSIS, 2023 201
16.4 REVENUE ANALYSIS, 2019–2023 202
16.5 COMPANY VALUATION AND FINANCIAL METRICS, 2024 204
16.6 BRAND/PRODUCT COMPARISON 206
16.7 COMPANY EVALUATION MATRIX: KEY PLAYERS, 2023 207
16.7.1 STARS 207
16.7.2 EMERGING LEADERS 207
16.7.3 PERVASIVE PLAYERS 207
16.7.4 PARTICIPANTS 207
16.7.5 COMPANY FOOTPRINT: KEY PLAYERS, 2023 209
16.7.5.1 Company footprint 209
16.7.5.2 Region footprint 210
16.7.5.3 Type footprint 211
16.7.5.4 Spectrum footprint 212
16.7.5.5 Application footprint 213
16.8 COMPANY EVALUATION MATRIX: STARTUPS/SMES, 2023 214
16.8.1 PROGRESSIVE COMPANIES 214
16.8.2 RESPONSIVE COMPANIES 214
16.8.3 DYNAMIC COMPANIES 214
16.8.4 STARTING BLOCKS 214
16.8.5 COMPETITIVE BENCHMARKING: STARTUPS/SMES, 2023 216
16.8.5.1 Detailed list of key startups/SMEs 216
16.8.5.2 Competitive benchmarking of key startups/SMEs 217
16.9 COMPETITIVE SCENARIO 218
16.9.1 PRODUCT LAUNCHES 218
16.9.2 DEALS 219
17 COMPANY PROFILES 221
17.1 KEY PLAYERS 221
17.1.1 SONY CORPORATION 221
17.1.1.1 Business overview 221
17.1.1.2 Products/Solutions/Services offered 222
17.1.1.3 Recent developments 225
17.1.1.3.1 Product launches 225
17.1.1.3.2 Deals 226
17.1.1.4 MnM view 226
17.1.1.4.1 Key strengths/Right to win 226
17.1.1.4.2 Strategic choices 226
17.1.1.4.3 Weaknesses/Competitive threats 226
17.1.2 SAMSUNG 227
17.1.2.1 Business overview 227
17.1.2.2 Products/Solutions/Services offered 229
17.1.2.3 Recent developments 230
17.1.2.3.1 Product launches 230
17.1.2.3.2 Deals 231
17.1.2.4 MnM view 231
17.1.2.4.1 Key strengths/Right to win 231
17.1.2.4.2 Strategic choices 231
17.1.2.4.3 Weaknesses/Competitive threats 231
17.1.3 OMNIVISION 232
17.1.3.1 Business overview 232
17.1.3.2 Products/Solutions/Services offered 233
17.1.3.3 Recent developments 237
17.1.3.3.1 Product launches 237
17.1.3.3.2 Deals 238
17.1.3.4 MnM view 239
17.1.3.4.1 Key strengths/Right to win 239
17.1.3.4.2 Strategic choices 239
17.1.3.4.3 Weaknesses/Competitive threats 239
17.1.4 STMICROELECTRONICS 240
17.1.4.1 Business overview 240
17.1.4.2 Products/Solutions/Services offered 242
17.1.4.3 Recent developments 242
17.1.4.3.1 Product launches 242
17.1.4.3.2 Deals 243
17.1.4.4 MnM view 244
17.1.4.4.1 Key strengths/Right to win 244
17.1.4.4.2 Strategic choices 244
17.1.4.4.3 Weaknesses/Competitive threats 244
17.1.5 GALAXYCORE SHANGHAI LIMITED CORPORATION 245
17.1.5.1 Business overview 245
17.1.5.2 Products/Solutions/Services offered 245
17.1.5.3 Recent developments 246
17.1.5.3.1 Product launches 246
17.1.5.3.2 Deals 246
17.1.5.4 MnM view 247
17.1.5.4.1 Key strengths/Right to win 247
17.1.5.4.2 Strategic choices 247
17.1.5.4.3 Weaknesses/Competitive threats 247
17.1.6 SEMICONDUCTOR COMPONENTS INDUSTRIES, LLC 248
17.1.6.1 Business overview 248
17.1.6.2 Products/Solutions/Services offered 249
17.1.6.3 Recent developments 251
17.1.6.3.1 Product launches 251
17.1.6.3.2 Deals 251
17.1.6.4 MnM view 252
17.1.6.4.1 Strategic choices 252
17.1.6.4.2 Weaknesses/Competitive threats 252
17.1.7 HAMAMATSU PHOTONICS K.K. 253
17.1.7.1 Business overview 253
17.1.7.2 Products/Solutions/Services offered 254
17.1.7.3 Recent developments 255
17.1.7.3.1 Deals 255
17.1.8 PANASONIC HOLDINGS CORPORATION 256
17.1.8.1 Business overview 256
17.1.8.2 Products/Solutions/Services offered 257
17.1.8.3 Recent developments 258
17.1.8.3.1 Product launches 258
17.1.9 SK HYNIX INC. 259
17.1.9.1 Business overview 259
17.1.9.2 Products/Solutions/Services offered 260
17.1.9.3 Recent developments 261
17.1.9.3.1 Product launches 261
17.1.10 CANON INC. 262
17.1.10.1 Business overview 262
17.1.10.2 Products/Solutions/Services offered 263
17.1.10.3 Recent developments 264
17.1.10.3.1 Product launches 264
17.2 OTHER PLAYERS 265
17.2.1 PIXART IMAGING INC. 265
17.2.2 PIXELPLUS 266
17.2.3 HIMAX TECHNOLOGIES, INC. 267
17.2.4 TELEDYNE TECHNOLOGIES INCORPORATED 268
17.2.5 SHARP CORPORATION 269
17.2.6 GPIXEL INC. 270
17.2.7 NUVOTON TECHNOLOGY CORPORATION 271
17.2.8 DIODES INCORPORATED 272
17.2.9 ISDI LIMITED 272
17.2.10 ANDANTA GMBH 273
17.2.11 PHOTONFOCUS AG 273
17.2.12 NEW IMAGING TECHNOLOGIES (NIT) 274
17.2.13 RUIXIN MICROELECTRONICS CO., LTD. 274
17.2.14 AMS-OSRAM AG 275
17.2.15 IMASENIC ADVANCED IMAGING S.L. 275
18 APPENDIX 276
18.1 INSIGHTS FROM INDUSTRY EXPERTS 276
18.2 DISCUSSION GUIDE 277
18.3 KNOWLEDGESTORE: MARKETSANDMARKETS’ SUBSCRIPTION PORTAL 280
18.4 CUSTOMIZATION OPTIONS 282
18.5 RELATED REPORTS 282
18.6 AUTHOR DETAILS 283
❖ 世界のイメージセンサ市場に関するよくある質問(FAQ) ❖
・イメージセンサの世界市場規模は?
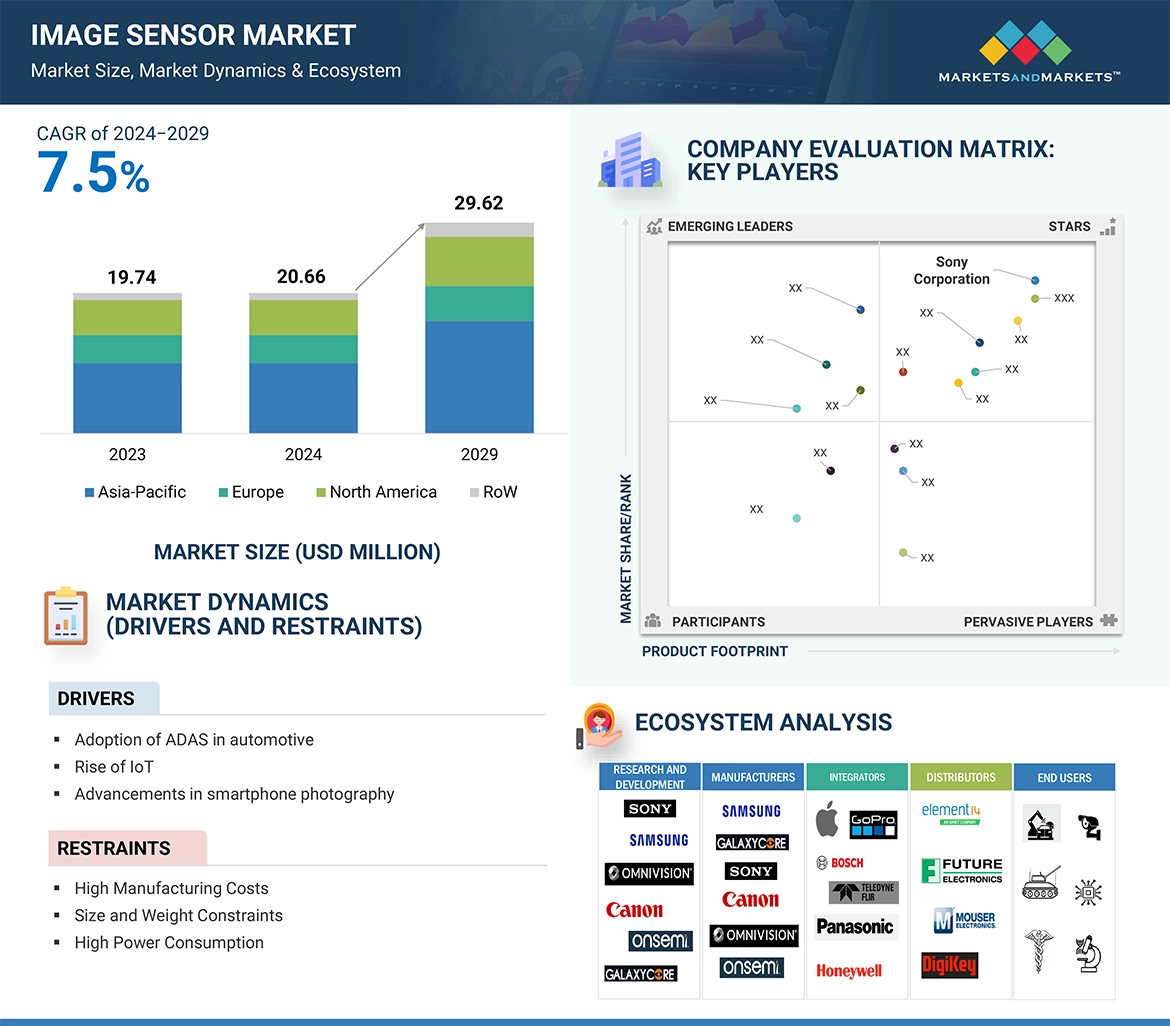
→MarketsandMarkets社は2024年のイメージセンサの世界市場規模を206.6億米ドルと推定しています。
・イメージセンサの世界市場予測は?
→MarketsandMarkets社は2029年のイメージセンサの世界市場規模を296.2億米ドルと予測しています。
・イメージセンサ市場の成長率は?
→MarketsandMarkets社はイメージセンサの世界市場が2024年~2029年に年平均7.5%成長すると予測しています。
・世界のイメージセンサ市場における主要企業は?
→MarketsandMarkets社は「Sony Corporation (Japan)、Samsung. (South Korea)、Omnivision (US)、Semiconductor Components Industries、LLC (US) and STMicroelectronics (Switzerland)など ...」をグローバルイメージセンサ市場の主要企業として認識しています。
※上記FAQの市場規模、市場予測、成長率、主要企業に関する情報は本レポートの概要を作成した時点での情報であり、納品レポートの情報と少し異なる場合があります。


